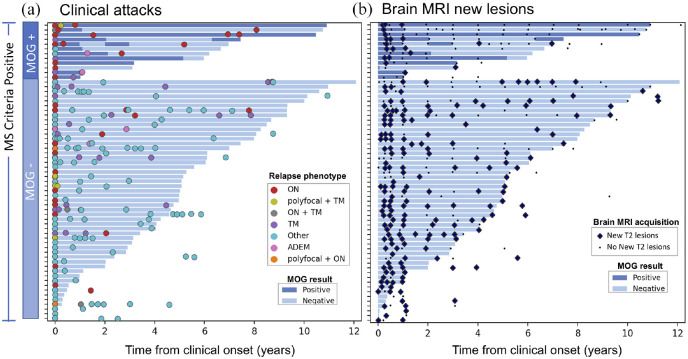
Figure 3.
Clinical and imaging disease course. Each bar indicates the serological follow-up of an individual participant, with dark and light blue colors indicating seropositive and seronegative status, respectively. (a) Colored circles correspond to clinical relapses. Participants initially MOG-IgG positive show a preponderance of episodes of monofocal ON. (b) Black dots indicate the time of acquisition of follow-up brain MRI scans with no new T2 lesions, while the large blue diamonds indicate the follow-up brain MRI with detection of new T2 lesions. New lesions were detected across both seropositive and negative participants, with most MOG-IgG positive participants showing new lesions at the earliest follow-up timepoints, and relatively few subsequently.

