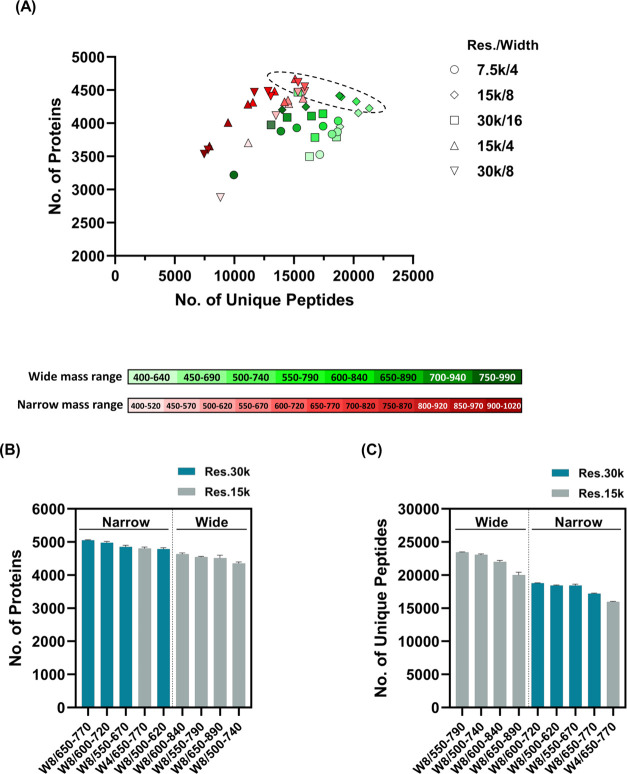
Figure 1.
Screening of suitable DIA with 5-min gradient LC. (A) The graphs indicate the number of proteins and peptides from 46 DIA. The numbers of proteins and peptides are plotted in longitudinal and horizontal axes, respectively. Individual identifications were obtained from 46 methods in a single-shot run. The graphs indicate the number of identified proteins (B) and peptides (C) from selected nine DIA methods. Individual DIA was measured in triplicate. In the graph, “Narrow” and “Wide” show precursor mass range in DIA for each method (120 and 240 Da).

