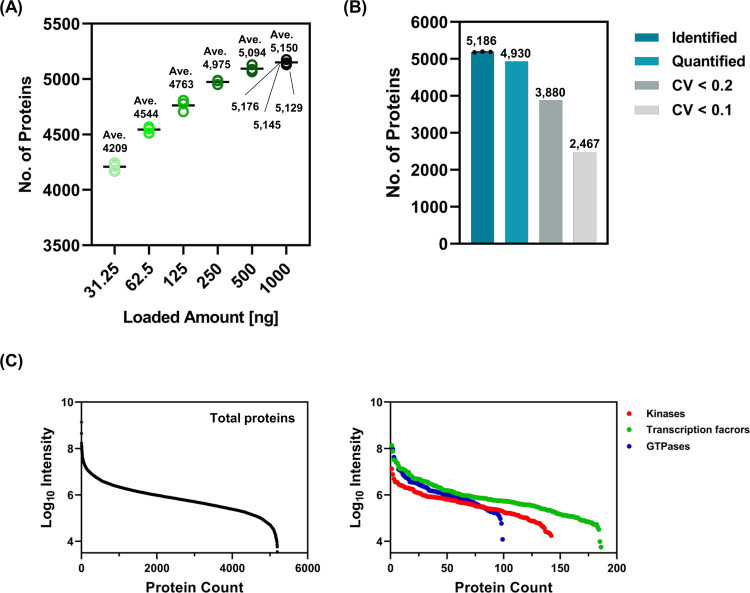
Figure 2.
Proteome coverage and reproducibility of the Res30k/W8/650–770 method. (A) The plotted graphs indicate the number of protein identifications in a single-shot run when injected with 31.25, 62.5, 125, 250, 500, and 1000 ng of HEK293T cell digest. (B) The bar graphs indicate the number of proteins using a 1000 ng cell digest with triplicate runs. The average identifications are indicated in the bar graph identified above. (C) The graphs plot protein counts of all proteins (left panel), kinases, transcription factor-related proteins, and GTPases (right panel). Kinases were summarized using the protein-annotated GO terms, “kinase activity”, “protein kinase activity,” and “receptor signaling protein serine/threonine kinase activity.” Transcription factors were summarized using the protein-annotated GO terms “transcription coactivator activity” and “transcription factor binding.” Overlapping proteins in each term were unified before summarization.

