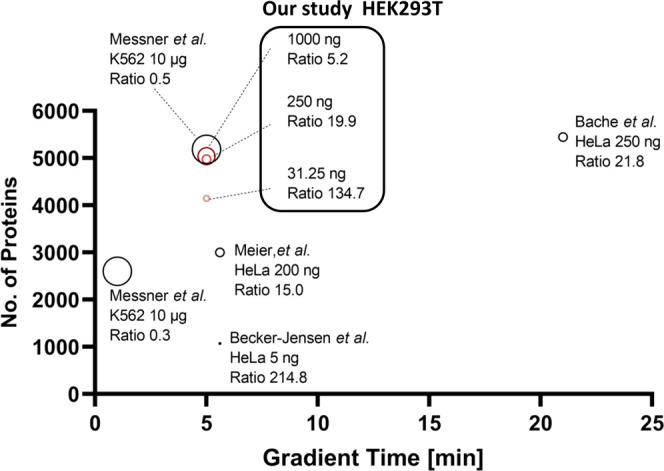
Figure 3.

Comparison between our method and previous methods of protein identifications. The graph shows protein identifications for different gradient times in individual methods. Previous methods were referred from refs 9, 12, 13, and 14. The protein identification ratio was calculated from protein identifications divided by digest amount [ng]. Dot size indicates loaded digest amount.
