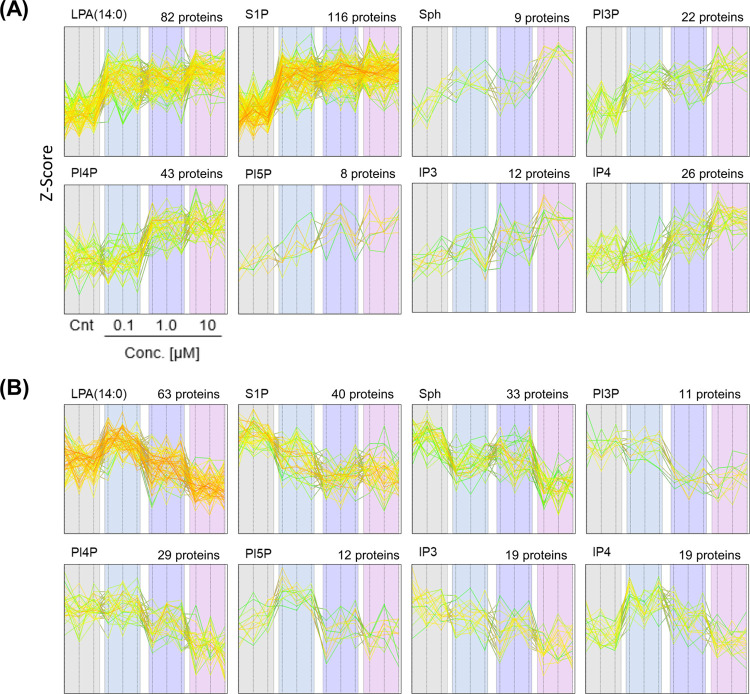
Figure 4.
Dose-dependent responsive proteins by chemical stimulus in HEK293T cells. The profile plots indicate the z-score with dose-dependent manner increased (A) and decreased (B) proteins by stimulations of eight substances. The number of altered proteins is shown above each profile plot. The stimulation assay was performed in triplicate.

