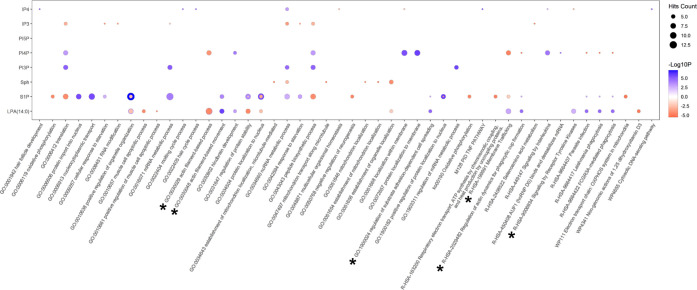
Figure 5.
Representative dose-dependent altered GO terms in HEK293T cells by each substance stimulation. The dot plot indicates dose-dependent manner increased and decreased GO terms with top 5 p-values in each stimulation. Notably, top 5 GO terms in other stimulations are also displayed, regardless of the p-value rank. Hit count represents the number of overlapping counts among individual stimulations. Blue and red dots show dose-dependent manner increased and decreased GO terms, respectively.

