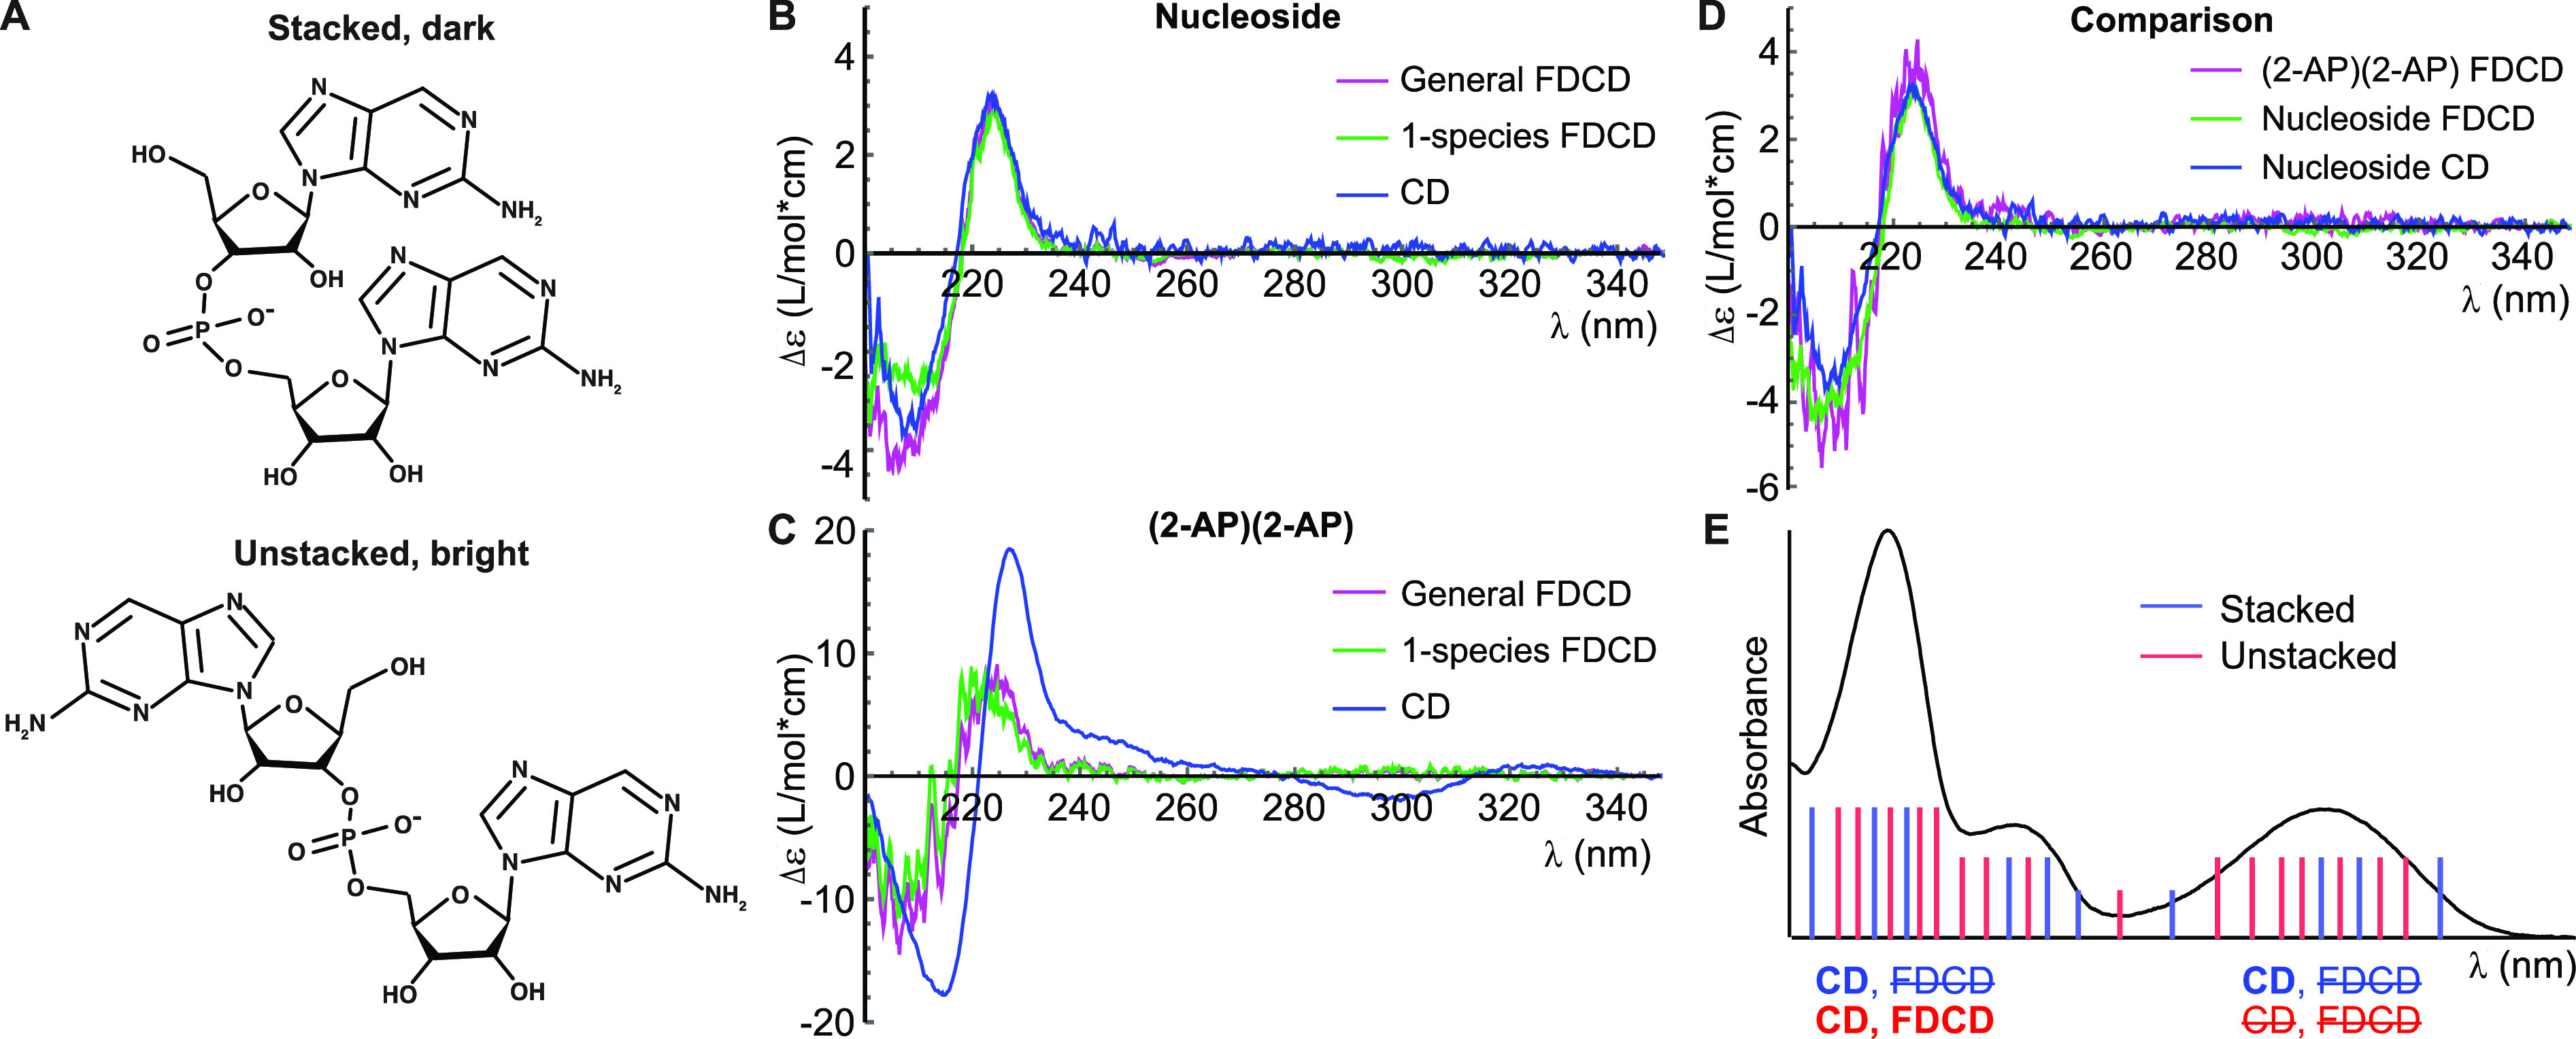
Figure 2.

(A) Schematic of 2-AP dinucleotide in a stacked conformation (top) in which it is highly quenched and a brighter unstacked conformation (bottom). (B) Spectra of 2-AP riboside. (C) Spectra of 2-AP dinucleotide. Magenta, FDCD spectra processed with eq 1; green, FDCD spectra processed with eq 2; blue, standard CD spectra. (D) Magenta: FDCD spectrum of 2-AP dinucleotide processed using eq 1 under the assumption that all observed fluorescence comes from unstacked “nucleoside-like” structures. This spectrum shows strong agreement with the nucleoside FDCD (green) and CD (blue) spectra. (E) Illustration of how CD and FDCD report on different conformational subpopulations. The inhomogeneously broadened absorbance spectrum of 2-AP dinucleotide contains contributions (sticks) from stacked (blue) and unstacked (red) conformations. Labels below absorption bands indicate whether the stacked and/or unstacked conformations contribute to that band’s FDCD and/or CD signal. Nonzero CD is observed when 2-AP has optical activity, while nonzero FDCD is observed when 2-AP is fluorescent and optically active.
