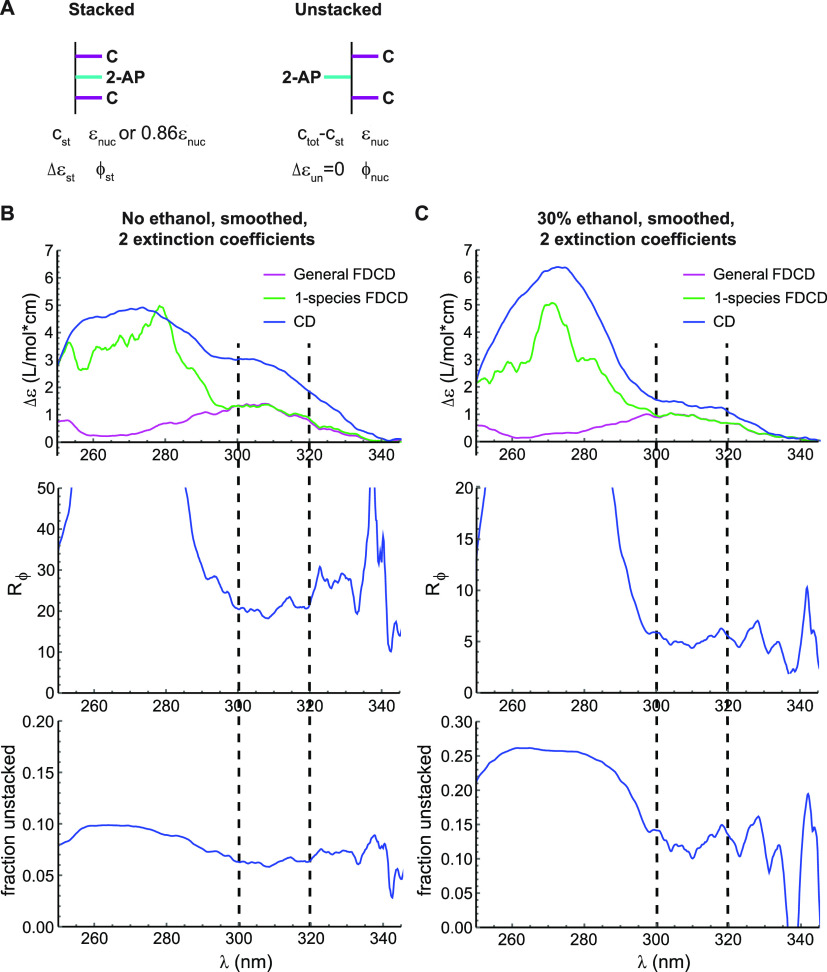
Figure 4.
Fluorescence quenching and stacking heterogeneity in C(2-AP)C. (A) Model used for data analysis. In the unstacked (“un”) conformation, 2-AP has properties characteristic of the free nucleoside “nuc”, while the stacked conformation (“st”) has a different CD signal and fluorescence quantum yield. c = concentration, ε = extinction coefficient, Δε = εL – εR, ϕ = quantum yield. (B) Results of the “smoothed, 2 extinction coefficient” model for C(2-AP)C in aqueous buffer. Top: Close-up of the long-wavelength region of Figure 3C. Magenta, FDCD spectra processed with eq 1; green, FDCD spectra processed with eq 2; blue, standard CD spectra. Middle: Value of the quenching ratio Rϕ obtained at each wavelength by solving the system of eqs 3 and 7. Bottom: Value of the fraction unstacked fun = (ctot – cst)/ctot obtained at each wavelength. Dashed lines indicate the wavelength range over which parameter values were quantified. (C) Analogous plots for C(2-AP)C in buffer containing 30% v/v ethanol.

