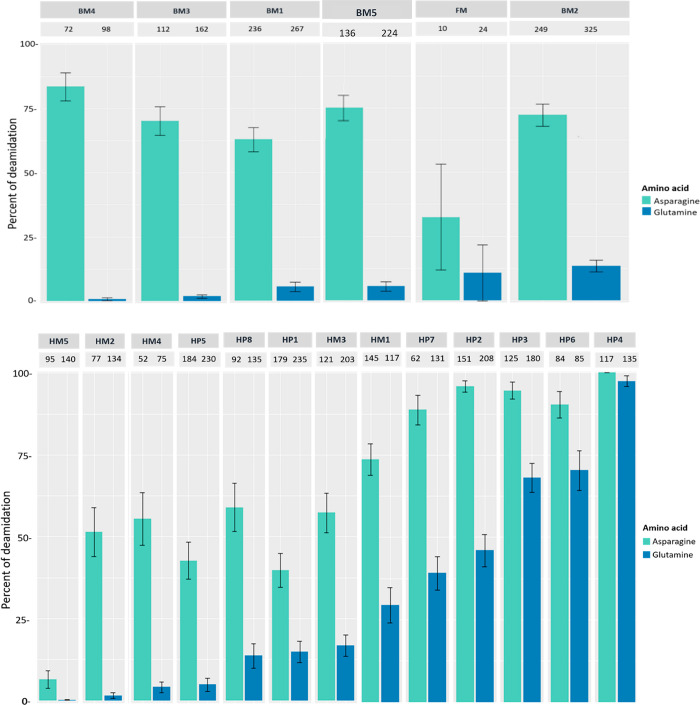
Figure 4.
Overall percentage of deamidation for asparagines (N) and glutamines (Q) residues for the collagen chains identified in the bone (upper panel) and hide (lower panel) glue samples. Error bars represent standard deviation and numbers above each bar represent the number of peptides the data is based on.

