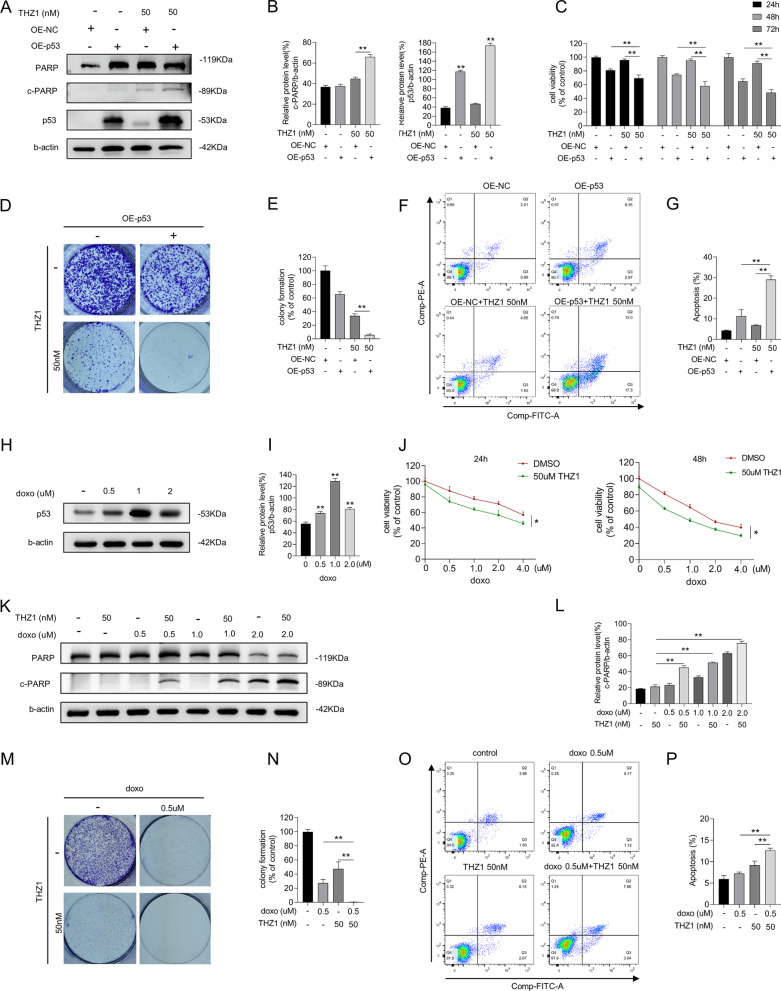
Fig. 3.
Increase p53 expression augmented cytotoxicity of THZ1. A The protein levels of cleaved PARP and p53 were detected by western blot. B Quantity of cleaved PARP and p53 in A. C Different time-point cell viability of MCF-7 cell after transfecting WT p53 plasmids and plasmids of control, then treated with 50 nM THZ1 was measured by CCK8 assay. D Colony formation ability measurement of MCF-7 cell after transfecting WT p53 plasmids or plasmids of control, then added with 50 nM THZ1. E Quantitation of colony formation ability in D. F Apoptosis was analyzed by flow cytometry after MCF-7 cells that transfected with WT p53 plasmids or plasmids of control were treated with 50 nM THZ1 for 48 h. G Quantity of apoptosis in F. H Western blot was utilized to verify p53 expression in MCF-7 cell under increasing concentrations of doxorubicin. I Quantity of p53 in H. J The cell viabilities of MCF-7 cell after treating with increasing concentrations of doxorubicin combining with 50 nM THZ1 or DMSO for 24 h and 48 h respectively were detected by CCK8 assay. K The protein level of cleaved PARP was detected by western blot. L Quantity of cleaved PARP in K. M Colony formation ability measurement of MCF-7 cell treated with 50 nM THZ1 and 0.5uM doxorubicin. N Quantitation of colony formation ability in M. O Apoptosis was analyzed by flow cytometry after MCF-7 cells treated with 50 nM THZ1 and 0.5uM doxorubicin for 24 h. P Quantity of apoptosis in O. Statistically significant (P < 0.05) are *, (P < 0.01) are **

