Fig. 4.

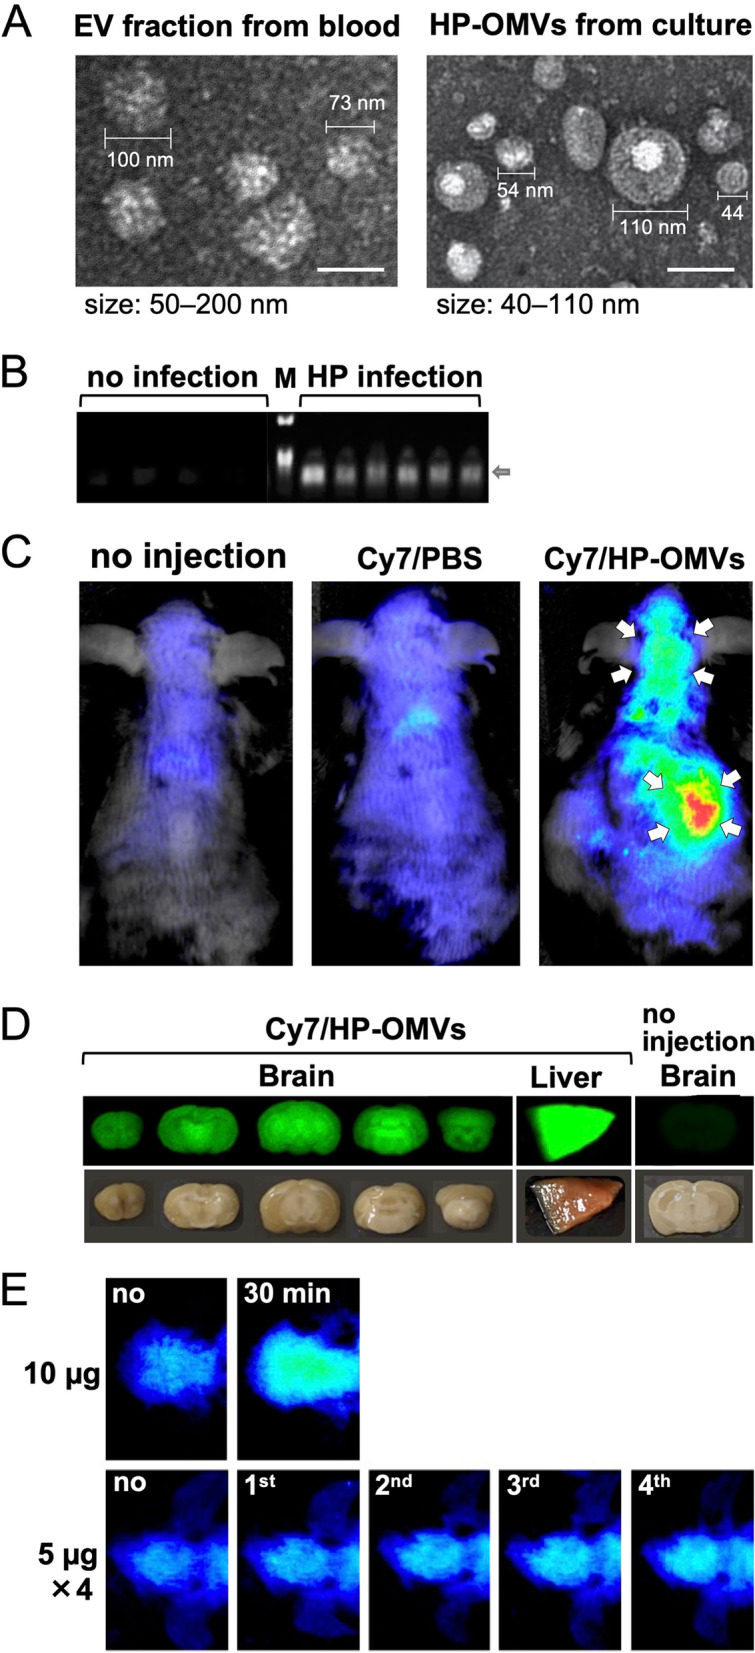
Isolation of HP-OMVs and their distribution in the body. A Electron microscopic images of the extracellular vesicle (EV) fraction from HP-infected mouse sera and HP-OMVs. Five months after HP infection, we collected the EV fractions from sera, using a total exosome isolation kit. We prepared HP-OMVs from an HP-SS1-cultured broth by filtration and ultracentrifugation. The size of vesicles from the EV fractions and HP-OMVs were 50–200 nm and 40–110 nm, respectively. Bar = 100 nm. B EV fractions were collected from HP-infected and uninfected mouse sera. A HP-specific 16S rRNA gene in the EV fractions was amplified by PCR and the products were subjected to agarose gel electrophoresis (arrow). M, DNA size marker. The HP-specific 16S rRNA gene (arrow) was detected only in the EV fractions from HP-infected mice but not in uninfected mice. C–E We isolated HP-OMVs from HP-cultured broth and labeled them with Hilyte Fluor 750 (Cy7) labeling Kit-NH2 (Dojindo Laboratory, Kumamoto, Japan). Cy7-labeled HP-OMVs (Cy7/HP-OMV, 10 μg/mouse) or control Cy7-containing phosphate-buffered saline (Cy7/PBS) was injected into mice intravenously, and the fluorescence was monitored in live mice by the Pearl Trilogy Imaging System (SCRUM, Inc., Tokyo, Japan). C Representative images of the dorsal side at 30 min after injection. The mouse injected with 10 μg of Cy7/HP-OMVs had a high fluorescent intensity around the liver and head areas (arrows) (n = 7). D 40 min after injection of Cy7/HP-OMVs, we killed and perfused mice with PBS, prepared the coronal brain sections, and examined the fluorescent intensities. We used the liver from the Cy7/HP-OMVs-injected mice as a positive control; we used the brain from non-injected mice as a negative control, confirming no autofluorescence in the brain of naïve mice. E We compared the Cy7 intensities of the head area between the mice receiving the 10 μg of a Cy7/HP-OMV single injection and mice receiving four injections of the 5 μg of Cy7/HP-OMVs with 30 min intervals (n = 7 and 2, respectively). Images of 4-time injections were taken 25 min after each injection; no, image was taken at 0 min; 1st, first injection at 0 min and the image was taken at 25 min; 2nd, the second injection at 30 min and the image was taken at 55 min; 3rd, the third injection at 60 min and the image was taken at 85 min; and 4th, the fourth injection at 90 min and the image was taken at 115 min. The fluorescent intensities increased depending on the number of injections
