Fig. 5.
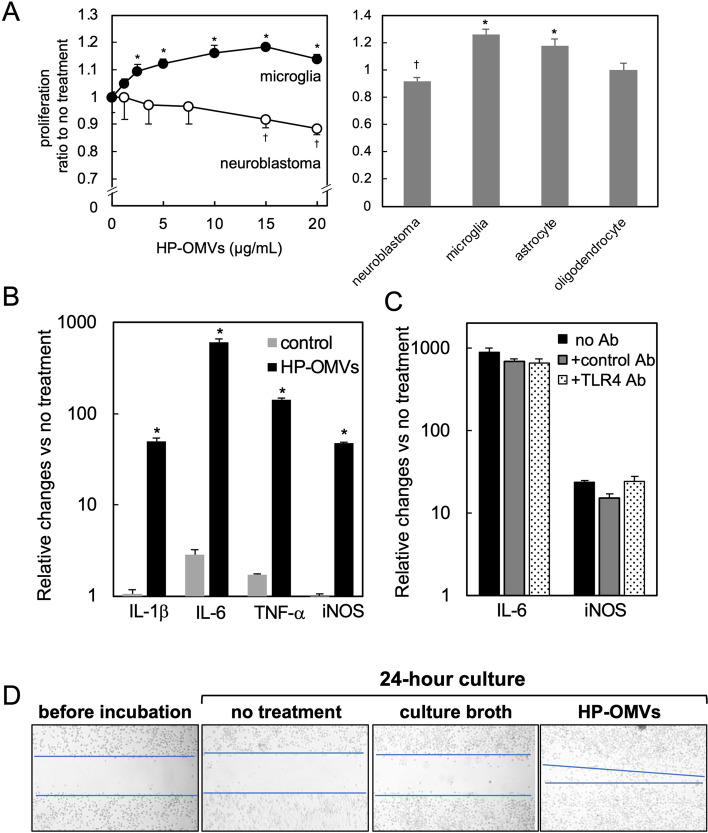
Enhancement of microglial proliferation, cytokine production, and migration. We determined the effects of HP-OMVs on cell proliferation, using four neuronal and glial cell lines (neuroblastoma, microglia, astrocyte, and oligodendrocyte). A (Left panel) HP-OMVs enhanced microglia proliferation but suppressed neuroblastoma proliferation. We incubated the cells with HP-OMVs for 24 h with different concentrations of HP-OMVs, then added the CCK-8 reagent for 1 h and measured the optical density at 450 nm. We calculated the proliferation ratio, dividing the optical density of the samples by that of untreated samples. A (Right panel) Four neuronal cell lines were incubated with 15 μg/mL of HP-OMVs for 24 h, and proliferation was determined by CCK-8 assay. HP-OMVs also enhanced proliferation of astrocytes, but not oligodendrocytes. †, significant suppression (P < 0.05, Student’s t test) compared with untreated control neuroblastoma; *, significant enhancement (P < 0.05) compared with untreated microglia or astrocytes. B We treated microglia with HP-OMVs for 9 h and determined the relative changes of mRNA levels of pro-inflammatory molecules (HP-OMV, black column), compared with the no treatment group, by real-time quantitative PCR (qPCR). HP-OMVs significantly upregulated the levels of interleukin (IL)-1β, IL-6, tumor necrosis factor (TNF)-α, and inducible nitric oxide synthase (iNOS). C Following 1-h pretreatment with toll-like receptor 4 (TLR4)-neutralizing antibody (Ab)(TLR4 Ab, hatched column) or the control Ab (gray column), we incubated microglia with HP-OMVs for 9 h. We found no differences in the mRNA levels of IL-6 or iNOS, compared with the group incubated with HP-OMVs alone (no Ab, black column). D We determined microglial migrative activities using a scratch assay with or without HP-OMV incubation. The microglial monolayer was scraped into a straight line to create a wound and cultured for 24 h. We took wound-closure images and plotted the interfaces (blue line) between the wound and cell fronts. The wound size was reduced only in HP-OMV culture, but not in two control cultures (no treatment and culture broth, see text). In all experiments in Fig. 5, n = 3 per group, and the experiments were repeated at least twice. *P < 0.05, compared with the controls by ANOVA

