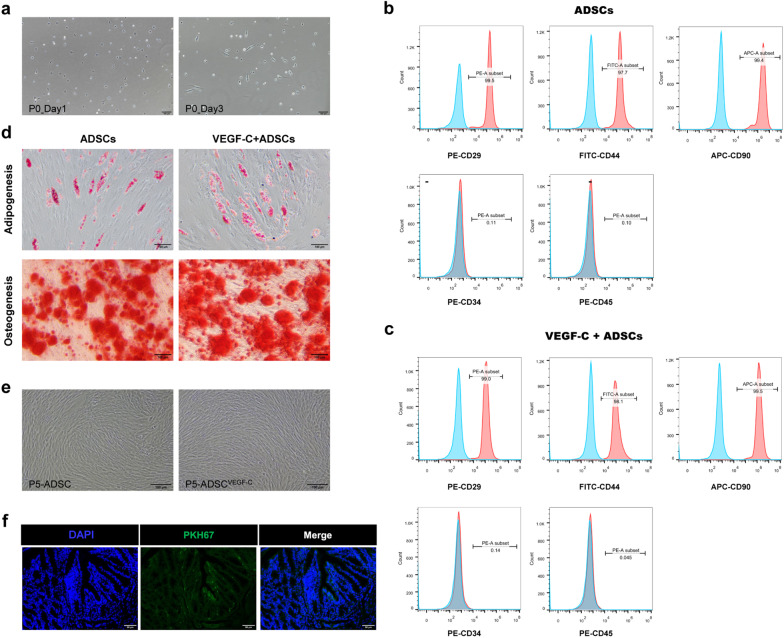
Fig. 2.
Characterization and identification of isolated ADSCs and VEGF-C stimulated ADSCs in vitro and homing of ADSCs in vivo. a Images of ADSCs in the primary passage on Day 1 and Day 3. Scale bar 100 μm; ×100, magnification. b, c Flow cytometry analysis of surface immunophenotype in the ADSCs and VEGF-C pretreated ADSCs, respectively. The blue line represents blank control and the red line represents marked ADSCs. d Detection of the multipotent capacity of ADSCs to induce adipogenic and osteogenic differentiation by Oil Red O and Alizarin Red staining, respectively. Scale bar 100 μm; × 200, magnification. e Images of ADSCs unstimulated and stimulated with VEGF-C at the 5th passage. Scale bar 100 μm; × 100, magnification. f The distribution of the injected PKH67-labelled ADSCs (green) in the murine colon under a fluorescence microscope with DAPI (blue). Scale bar 100 μm; × 200, magnification

