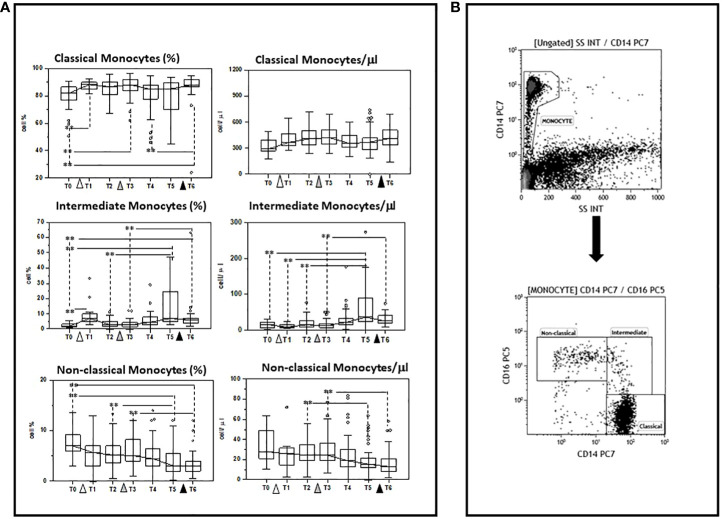
Figure 2.
Modulation of monocyte subpopulations by multiple doses of the BNT162b1 vaccine. (A) Summary results indicating different monocyte subsets are shown as percentages (medians) in the left panel and as absolute numbers in the right panel. Individuals who had never been SARS-CoV-2-infected and received three doses of the BNT162b1 mRNA vaccine were analysed at different time points: baseline (immediately before the first inoculation (white triangle) (T0), 7 (T1) and 21 (T2) days after initial inoculation, one (T3), three (T4) and six (T5) months after the first vaccine booster (grey triangle), and, finally, ten days after the second vaccine booster (black triangle) (T6). Boxes stretch from the 25th to the 75th percentile. Lines across the boxes indicate the median values. Lines stretching from the boxes indicate extreme values. Statistical significance is shown. **p<0.05 (B) Gate strategy to selected monocyte cell subsets: (A) the CD14+vs SSC dot plot allows the discrimination of monocyte (B) monocyte subsets were defined in the CD14 vs CD16 dot plot as: Classical (CD14highCD16neg), intermediate (CD14dim/CD16dim), and non-classical (CD14dim/neg/CD16bright) monocytes.

