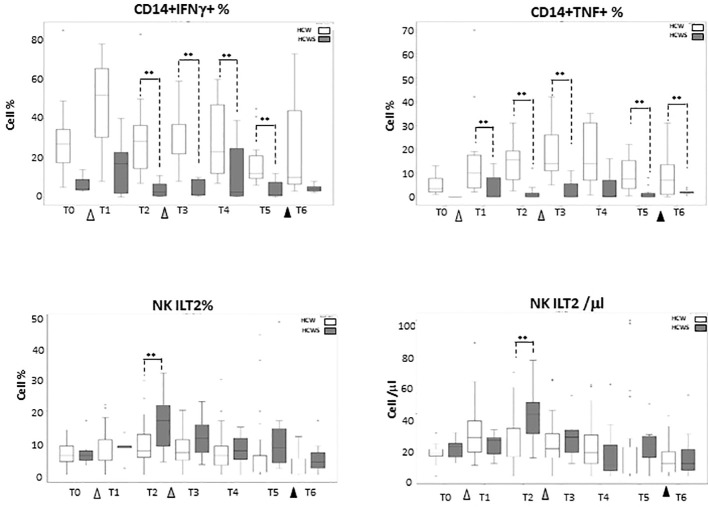
Figure 6.
Innate Immune Responses stimulated by multiple doses of the BNT162b1 vaccine in individuals who had or had not been SARS-CoV-2-infected. IFN-γ-producing monocytes; TNF-producing monocytes and ILT-2-expressing NK cells in individuals who had not (HCW; white bars) or had (HCWS; black bars) been SARS-CoV-2-infected prior to the initiation of the vaccine protocol. Median values are shown at baseline (immediately before the first inoculation (white triangle) (T0), 7 (T1) and 21 (T2) days after initial inoculation, one (T3), three (T4) and six (T5) months after the first vaccine booster (grey triangle), and, finally, ten days after the second vaccine booster (black triangle) (T6). The boxes stretch from the 25th to the 75th percentile. The lines across the boxes indicate the median values. The lines stretching from the boxes indicate extreme values. Statistical significance is shown; **p<0,05.

