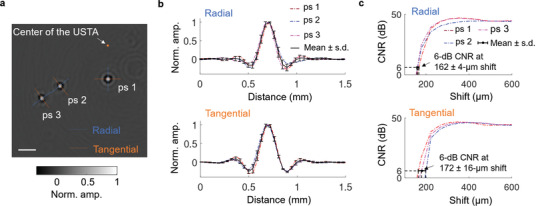
Figure 4.

Characterization of CRUST. a) Reconstructed acoustic point scatterers located at different distances from the USTA's center. The image is normalized to the maximum pixel value and presented in real values. b) Amplitude distributions along the radial and tangential line profiles in (a). The curves are normalized to the maximum values to facilitate comparison. c) CNR versus the shift in the sum of each original line profile in (b) and the shifted one. The contrast is defined as the average amplitude difference between the crest and the trough of the summed profile over 28 repeated measurements. The single‐measurement noise is defined as the root‐mean‐square of the amplitude standard deviations at the crest and trough across 28 repeated measurements. Scale bar = 1 mm; Norm. = normalized; Amp. = amplitude.
