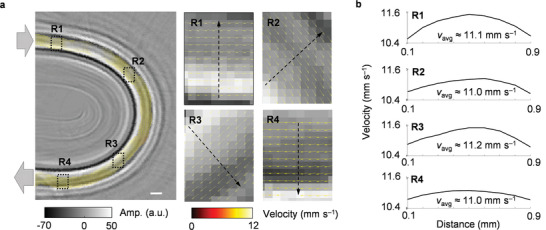
Figure 7.

Ex vivo vector flow estimation by CRUST. a) Velocity map overlaid on the structural image of a U‐shaped tube. R1 and R4 refer to the straight‐tube regions near the entrance and exit. R2 and R3 represent the bent‐tube regions. Magnified flow velocity vectors in R1–R4 are shown on the right. b) Velocity amplitude distributions along the line profiles in R1–R4. The computed average velocities are denoted by v avg. Scale bars = 1 mm; Amp. = amplitude.
