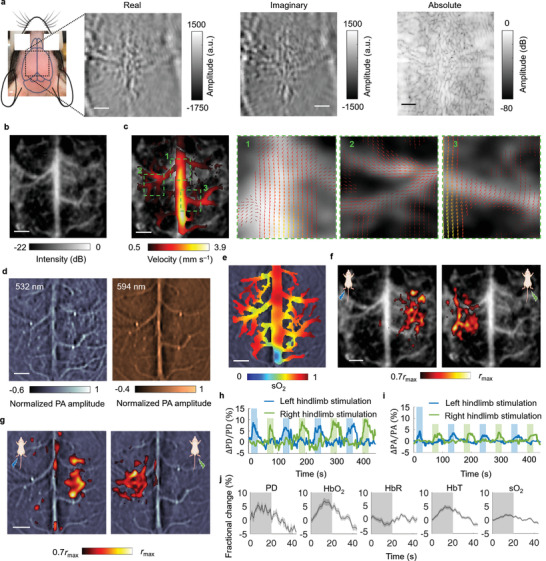
Figure 9.

CRUST‐PAT of the mouse brain with the intact scalp and skull. a) Widefield CRUST images displayed with real, imaginary, and absolute pixel values. b) PDI of the mouse brain. c) Velocity amplitude map of the CBF in the major cortical vessels (left). Flow vectors in regions 1–3 are magnified and displayed on the right. d) Widefield PAT images acquired at 532‐ and 594‐nm optical wavelengths. The images are normalized to the maximum pixel values. e) sO2 map estimated using the widefield PAT images acquired at the two wavelengths. f) CRUST‐measured functional responses presented using the Pearson correlation coefficients thresholded at 70% of the maximum (r max), showing contralateral functional responses to the hindlimb electrical stimulation. g) PAT‐measured functional maps presented in the same way as (f). h) Functional signal of CRUST. The signal represents the moving average (temporal window size of 4 s) of the mean values of the activated pixels in (f). i) Functional signal of PAT presented in the same way as (h). j) Computed fractional changes of PD, hemoglobin concentrations, and sO2 signal in response to stimulation. Data are mean ± s.e.m., n = 8 stimulation cycles, technical replicates. For scale bars = 1 mm.
