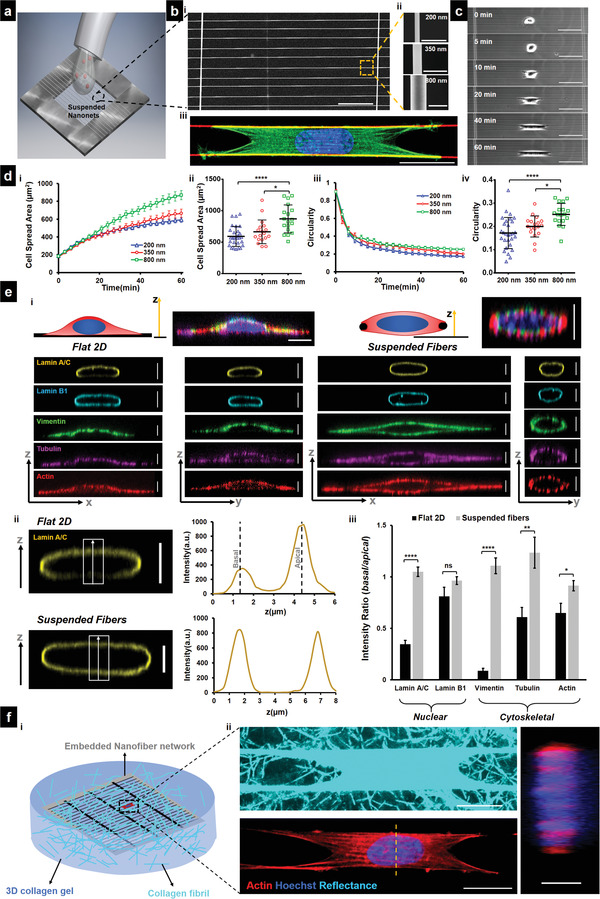
Figure 1.

Cell spreading on suspended fiber networks: a) Schematic of assay used for studying cell spreading. Cell suspension is dropped on top of suspended nanonets coated with fibronectin and imaged in real‐time. b[i]) SEM image of suspended nanonet (Scale bar = 50 µm). b[ii]) SEM images of three different fiber diameters 200, 350, and 800 nm used for the study, (Scale bar = 1 µm) and b[iii]) representative cell (stained for Actin‐green, DAPI – blue, and fiber – red) on a 2‐fiber (diameter = 350 nm) doublet (Scale bar = 20 µm). c) Images from time lapse microscopy showing different phases of cell spreading on a 2‐fiber doublet. (Scale bar = 50 µm) d[i,iii]) Temporal evolution of cell spreading area and circularity, respectively (n = 16–29 cells per category). d[ii,iv]) Statistical comparison of cell spread area and circularity, respectively, after 1 h of spreading. e[i]) Representative immunofluorescence images showing differences in localization of cytoskeletal elements and nuclear envelope proteins between Flat 2D and suspended nanonets. Cytoskeletal elements form a “caging” structure surrounding the nucleus, while on 2D they “cap” the nucleus from apical side (Scale bars = 5 µm). e[ii]) Representative confocal side views (xz) along with intensity profiles along the z‐direction, first and second intensity peaks correspond to basal and apical surfaces, respectively (Scale bar = 5 µm). e[iii]) Comparison of the basal and apical intensity for the different cytoskeletal and nuclear envelope proteins (n = 10–11 per category) demonstrating intensity ratio values close to 1 for suspended nanonets (diameter = 200 nm) due to caging of the nucleus, absent in cells on 2D. Images and data are shown for C2C12 myoblasts: f[i]) Schematic showing cells attached to a nanofiber network embedded in a 3D collagen gel with an image of a representative embedded cell stained for actin and nucleus (Scale bar = 20 µm). [ii] Collagen gel fibrils are visualized via confocal reflectance microscopy, and cross‐sectional views demonstrate nuclear caging by actin stress fibers (Scale bar = 5 µm). 1‐way ANOVA with Tukey's multiple comparison test was used for (d[ii,iv]), Student's t‐test was used for comparison between Flat 2D and suspended fibers for each cytoskeletal and nuclear envelope protein in (e[iii]), *,**,***,**** represent p < 0.05, 0.01, 0.001, and 0.0001, respectively.
