
Figure 2.
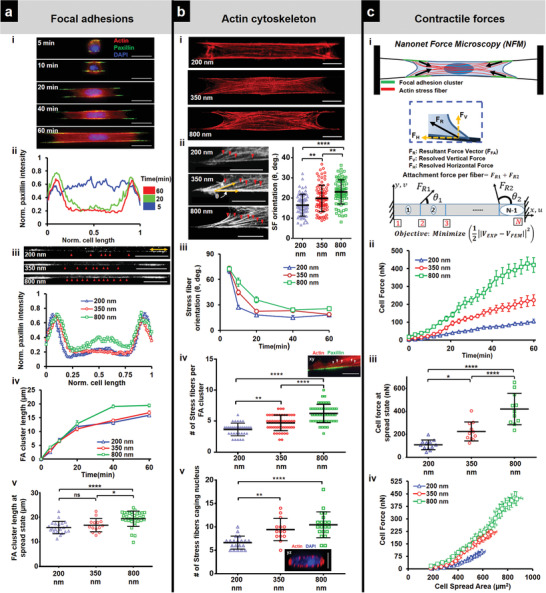
Cell contractility during spreading: a) Focal adhesion (FA) organization: a[i]) Representative images showing cells stained for actin (red), paxillin (green), and DAPI (blue) at different timepoints during spreading (fiber diameter = 350 nm) (Scale bars = 20 µm). a[ii]) Normalized paxillin intensity (average of 9–12 profiles for each timepoint) showing spatiotemporal reorganization of focal adhesions as cells spread, a[iii]) Differences in FA organization in clusters (yellow arrow) at the poles and along cell body‐fiber length (red arrowheads) for different fiber diameters (Scale bars = 20 µm). a[iv]) Temporal evolution of FA cluster lengths. a[v]) Comparison of FA cluster lengths at final spread state, n = 21, 14, and 33. b) Actin cytoskeleton organization: b[i]) Maximum intensity projections of actin cytoskeleton at spread state (60 min) (Scale bars = 10 µm). b[ii]) Stress fiber angle formed at the focal adhesion cluster zones, n = 68, 88 and 80 (Scale bars = 10 µm). b[iii]) Transient evolution of orientation of the stress fibers during spreading. b[iv]) Number of major stress fibers originating from each FA clustering zone, n = 33, 49, and 47. b[v]) Number of major stress fibers caging the nucleus, n = 20, 14, and 20. Inset are representative images of FA clustering zone (Scale bars = 10 µm) and nucleus caging with actin networks (Scale bars = 5 µm). c) Contractile forces: c[i]) Schematic of force measurement using Nanonet Force Microscopy (NFM) technique. c[ii]) Transient cell attachment force evolution during spreading (n = 11–12 cells each diameter category). c[iii]) Comparison of cell forces at spread state between the different fiber diameters. c[iv]) Relationship between cell forces and cell spread area. Cell forces are computed from both fibers. Sample sizes are given for 200–200, 350–350, and 800–800 nm diameter doublets, respectively. Images and data are shown for C2C12 myoblasts.