Figure 5.

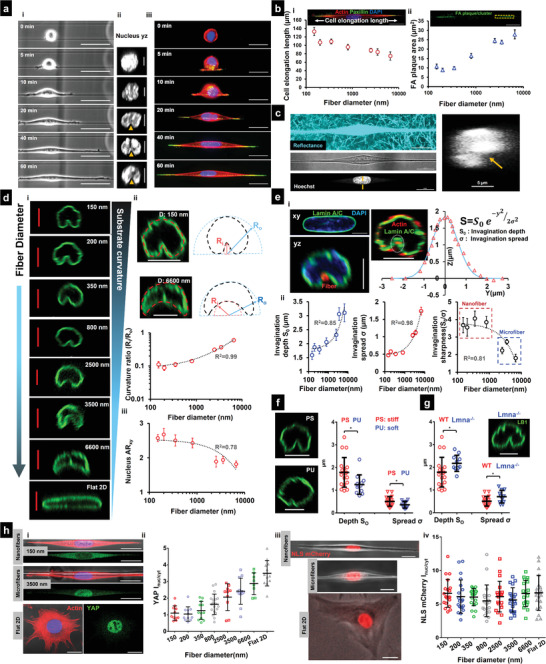
Sculpting nucleus invaginations using the curvature of single fibers. a[i]) Time‐lapse images showing different phases of cell spreading on a 1‐fiber system causing cells to spread in elongated spindle shapes (Scale bars = 50 µm). [ii] Confocal side views of representative cells at various spreading time points demonstrate the fiber–mediated nuclear deformations (yellow arrowheads, Scale bars = 5 µm). [iii] Cytoskeletal and focal adhesion arrangement in spindle‐shaped cells at various timepoints, actin (red), paxillin (green), and nucleus (blue) (Scale bars = 20 µm). b[i,ii]) Fiber‐diameter dependence of cell elongation length and FA plaque/cluster area (Scale bars = 20 µm). c) Representative C2C12 cell attached to single nanofibers, embedded within a 3D collagen gel. Collagen gel fibrils are visualized via confocal reflectance microscopy, and cross‐sectional views demonstrate the presence of invaginations (yellow arrow) at the local site where the nanofiber is present (Scale bars = 20 and 5 µm). d[i]) Representative images showing the effect of substrate curvature (fiber diameter) on the invagination shape/size (Scale bars = 5 µm). d[ii]) Representative images of the deformed nucleus shape on two diameters (150 and 6000 nm, Scale bars = 5 µm) and methodology for comparing invagination shapes: Fiber diameter dependence of Curvature ratio—Radius of curvature at the invagination side (R i) divided by radius of curvature at the nucleus apical side (R o), n = 12, 10, 17, 10, 10, 9, and 9, respectively. d[iii]) Nucleus aspect ratio (top view, xy) as a function of fiber diameter, n = 14, 10, 10, 11, 10, 6, and 6, respectively, Lamin A/C is stained in green. e[i]) Nucleus in spindle cells exhibit invaginations near sites of external fibers (red circle). Representative image showing cytoskeletal caging of the nucleus in spindle cell, actin (red), and Lamin A/C (green) (Scale bars = 5 µm). Invagination shape (shown in white circle) can be approximated with a bell curve. e[ii]) Invagination depth and spread increase with fiber diameter, while invagination sharpness decreases with increase in fiber diameter, n = 9–19 cells per diameter category. f) Influence of fiber stiffness in the regulation of invagination size, n = 19, 12 for fibers of similar diameter (≈350 nm) of PS (stiff E ≈ 1–3 GPa) and PU (soft E ≈ 1–10 MPa), respectively (Scale bars = 5 µm). g) Influence of impaired nuclear lamina on invagination size in cells attached to 350 nm diameter fibers, n = 19, 11 for control, Lamin A/C KD, respectively (Scale bars = 5 µm). h[i]) Representative stained images showing YAP localization in cells on nanofibers, microfibers, and Flat 2D (Scale bars = 20 µm). h[ii]) Comparison of YAP localization (I nuc/I cyt) in cells on different fiber diameters and Flat 2D, n = 11, 11, 12, 19, 10, 12, 8, and 12 cells, respectively. h[iii]) Representative images of cells expressing NLS mCherry, showing primary nuclear localization of NLS on nanofibers, microfibers and flat 2D (Scale bars = 20 µm). h[iv]) Comparison of NLS localization (I nuc/I cyt) in cells on different fiber diameters and Flat 2D, n = 20 cells for each category. All R 2 values shown are calculated for linear fits. Images and data are shown for C2C12 myoblasts.
