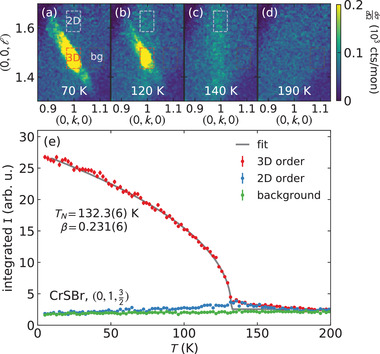
Figure 2.

Single crystal CrSBr neutron diffraction. a– d) The temperature evolution of the Bragg peak (which is smeared out in Q ⊥ due to crystal twinning) is shown. Above and near the phase transition, a streak of scattering along ℓ appears, signaling two‐dimensional (2D) magnetic correlations. We track the 3D and 2D correlations using the red and white boxes in panels (a– d) (the black box is the background), plotted in panel (e). The 2D correlations peak at the ordering temperature T N = 132.2(6) K, and decrease at lower temperatures. The fitted order parameter curve is shown in gray, with a fitted β = 0.231(6). Error bars indicate one standard deviation uncertainty.
