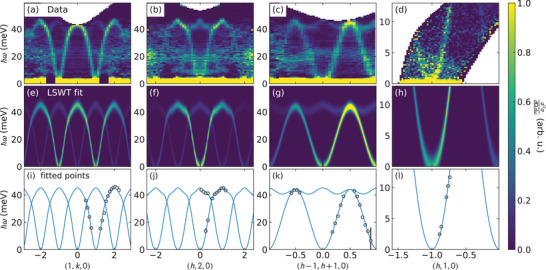
Figure 3.

Measured and fitted spin wave spectra of CrSBr. The top row (a– d) shows the measured spin wave spectra of CrSBr. Panels (a– c) were measured with E i = 70 meV neutrons, while panel (d) was measured with E i = 20 meV neutrons. The middle row (e– h) shows the LSWT calculated spectrum from the best fit Hamiltonian in Table 1. The bottom row (i– l) shows a portion of the data points used in the fit (black circles), and the fitted dispersion (blue solid line). For a complete list of fitted data, see the Supporting Information.
