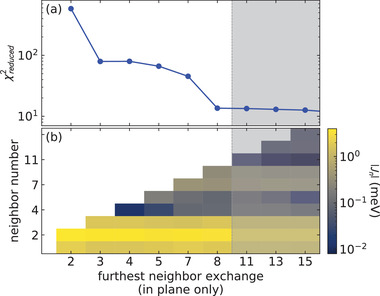
Figure 5.

Dependence of the best fit on the number of neighbors included in the fit. Panel (a) shows versus neighbor number n, and panel (b) shows these fitted values in a colormap. Beyond the eighth neighbor, the does not appreciably improve by adding additional neighbors, so we truncate our model at the eighth neighbor.
