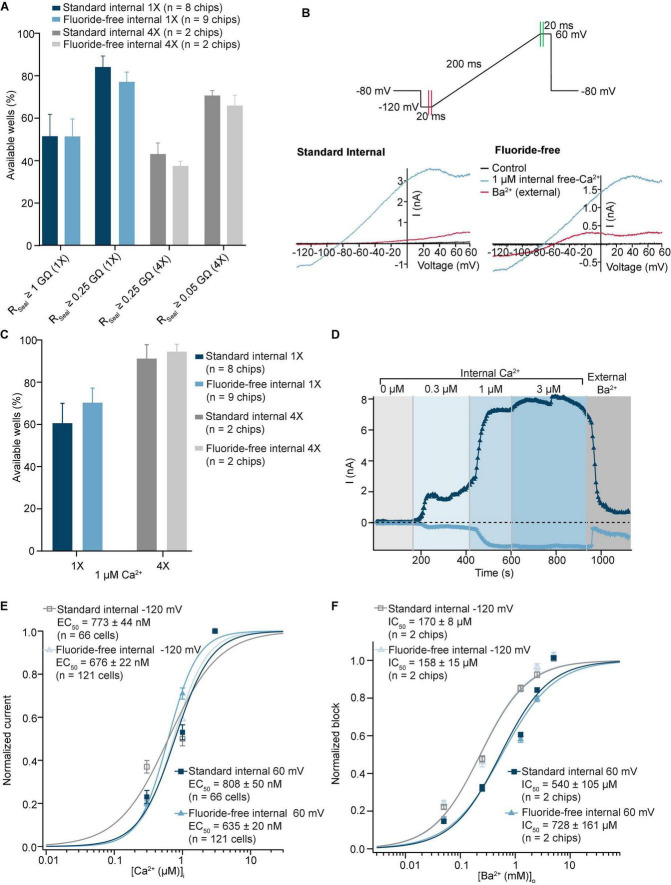
FIGURE 6.
Activation by internal free Ca2+ of KCa3.1 recorded in standard and fluoride-free internal solution. (A) CHO cells expressing KCa3.1 were captured with almost 50% success rate for RSeal ≥ 1 GΩ with standard and in fluoride-free internal solution (left). If a QC cutoff of RSeal ≥ 0.25 GΩ was used, the success rate was increased in both conditions (right). Similar success rates were also achieved with multi-hole (4X) chips (gray). (B) Raw current traces from example CHO cell expressing KCa3.1 recorded in both standard and fluoride-free internal solution, activated by 1 μM free internal Ca2+ and blocked by 1 mM Ba2+ (external). (C) Success rates after applying initial RSeal (>0.25 GΩ) and current QC plot of IPeak values at –120/60 mV for standard and fluoride-free solutions after internal application of 1 μM free Ca2+. (D) IT plot during application of internal free Ca2+ with 0.3, 1, and 3 μM free internal Ca2+ and subsequent block by external Ba2+ (1 mM) at –120/60 mV. (E) Current values at –120 or 60 mV in increasing concentrations of internal free Ca2+ were normalized to maximum peak amplitude and fit using a Hill equation which shows a slightly increased EC50 in standard internal solutions for both voltages. Shown are mean ± S.E.M. (F) Current values at –120 or 60 mV in increasing concentrations of external Ba2+ were normalized to maximum peak amplitude and fit using a Hill equation which showed no difference in the IC50 at –120 mV between standard internal (170 ± 8 μM, n = 2 chips) and fluoride-free internal (158 ± 15 μM, n = 2 chips) or 60 mV, although the IC50 was higher at 60 vs. –120 mV for both groups (540 ± 105 μM, n = 2 chips in standard external and 728 ± 161 μM, n = 2 chips in fluoride-free internal solution). IC50 values are given as mean of 2 chips ± S.D.

