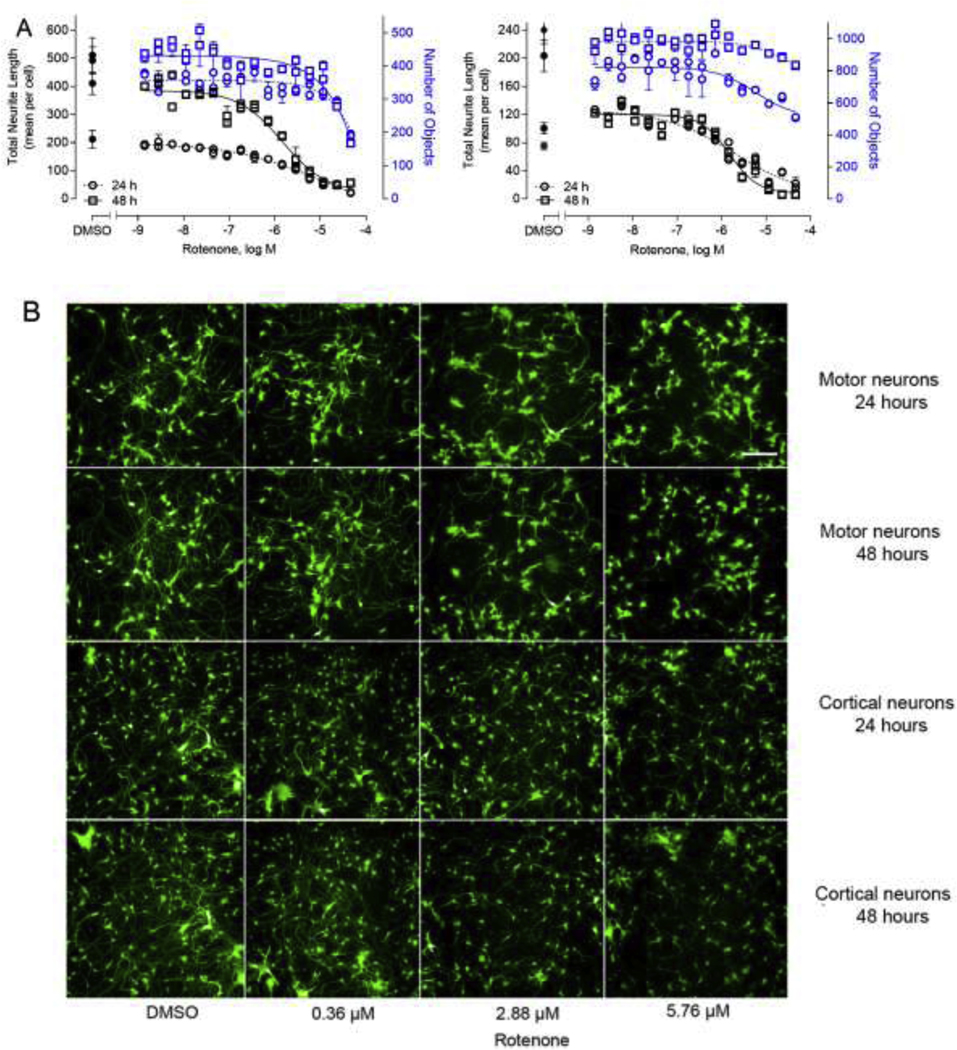
Fig. 2.
Concentration-response curves and representative images of the neurons in response to rotenone treatment. Motor neurons and cortical neurons labeled with GFP were cultured in 1536-well format and treated with varying concentrations of rotenone for 24 and 48 hours, respectively. There were dose curves in 1536-well using both motor neurons and cortical neurons (A). Blue circles (24 hours) and squares (48 hours) in the curves represent the number of objects listed on the right axis. Black circles (24 hours) and squares (48 hours) represent the total neurite length listed on the left axis for reference of neurite outgrowth. The unit of neurite length is expressed as pixel. The neurite growth was inhibited using rotenone treatment (0.36, 2.88 and 5.76 μM) for 24 and 48 hours, and DMSO was used as the negative control (B). The images were acquired using Operetta High-Content Imaging System with a 20× Plan Fluor objective (Nikon). Excitation: 488 nm; emission: 530 nm. Each value represents the mean ± SD of three independent experiments. Scale bar: 100 μm.

