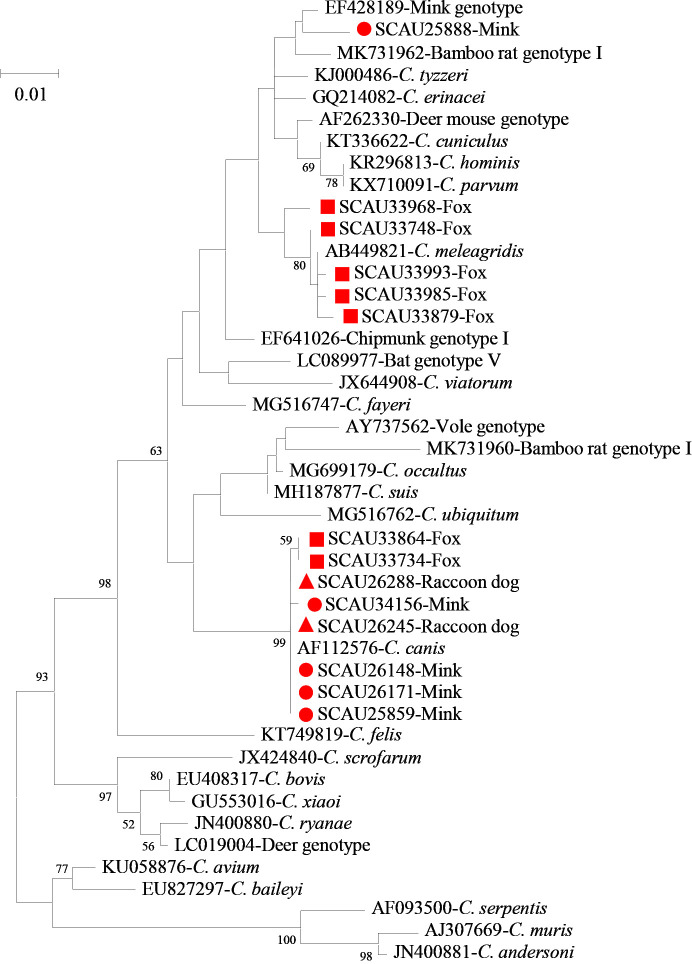
Figure 1.
Phylogeny of Cryptosporidium spp. based on the maximum likelihood analysis of the partial SSU rRNA gene using the general time-reversible model for the calculations of substitution rates. Bootstrap values greater than 50% from 1,000 replicates are displayed. Samples detected in minks, raccoon dogs and foxes from this study are indicated with red circles, triangles, and squares, respectively.

