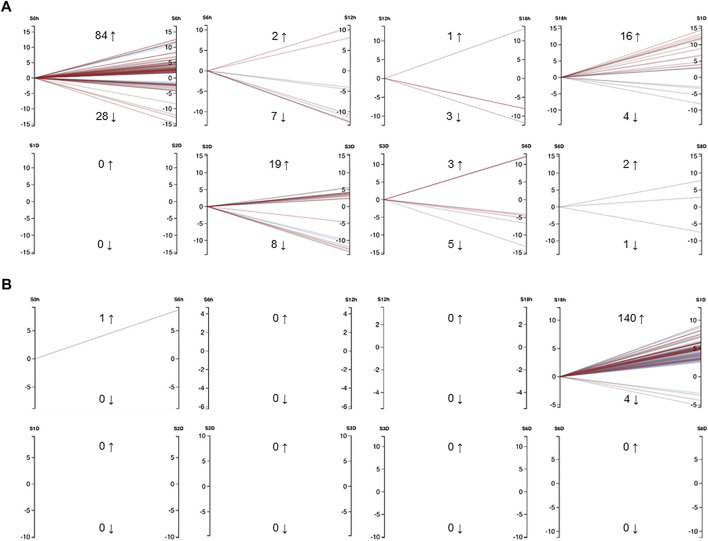
FIGURE 4.
(A) Differentially expressed mRNAs in Exaiptasia pallida tentacle regeneration that had a minimum CPM of 50 in at least 3 samples. Cut-off values were set to FDR = 0.05, abs logFC = 1. (B) Differentially expressed miRNAs in E. pallida tentacle regeneration that had a minimum CPM of 5 in at least 3 samples. Cut-off values were set to FDR = 0.05, abs logFC = 1. Numbers adjacent to upwards and downwards arrows indicate the number of genes or miRNAs that were upregulated and downregulated respectively, e.g. from 0 hpa to 6 hpa, 84 mRNAs were upregulated and 28 mRNAs were downregulated. Each line is colored by FDR with red being more significant and blue less significant. S0h: 0 h post amputation (hpa), S6h: 6 hpa, S12h: 12 hpa, S18h: 18 hpa, S1D: 1 day post amputation (dpa), S2D: 2 dpa, S3D: 3 dpa, S6D: 6 dpa, S8D: 8 dpa. The graphs were generated using Degust (DOI: 10.5281/zenodo.3258932) (Powell, 2015).

