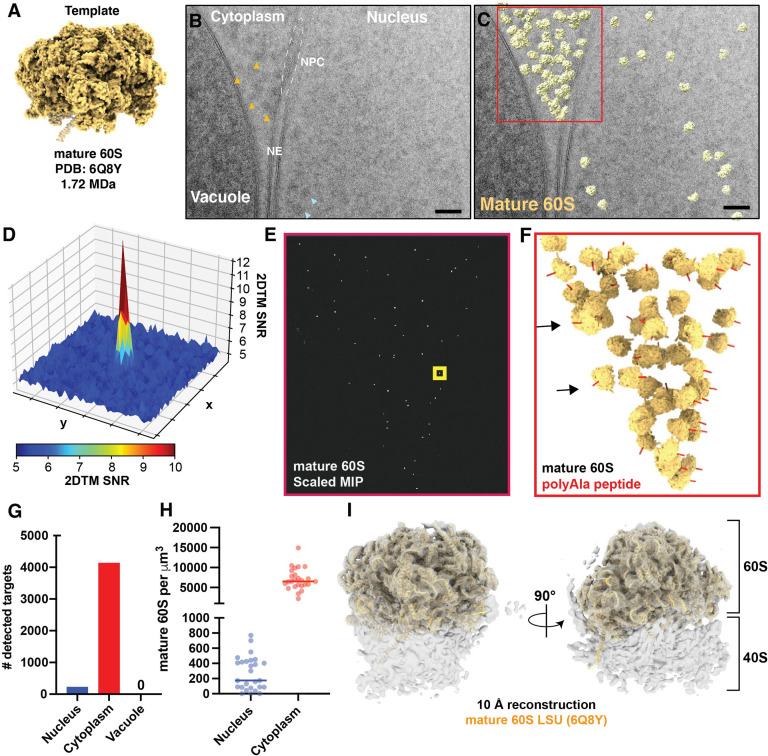
Figure 1. Detection of cytoplasmic mature 60S and mitochondrial ribosomes in 2D images of FIB-milled yeast lamella.
(A) Cryo-EM like density generated using the atomic coordinates of PDB: 6Q8Y that correspond with the mature 60S. (B) TEM image of the nuclear periphery from a FIB-milled yeast lamella. Yellow arrows indicate low-resolution features in the cytoplasm that may indicate the presence of ribosomes. Blue arrows indicate regions of similar size and contrast in the nucleoplasm. NE: nuclear envelope; NPC: nuclear pore complex. (C) Cryo-EM micrograph of yeast nuclear periphery from FIB-milled lamella with the results from a 2DTM search using the mature 60S template. Significant targets are indicated by mapping the template in the best matching locations and orientations (shown in yellow). The red box indicates the regions highlighted in (E) and (F). Scale bar = 50 nm. (D) 3D surface representation showing the pixel-wise 2DTM SNRs in the 50x50 pixel region of the normalized maximum intensity projection (MIP) indicated by the yellow box in (E). Each square represents 10x10 pixels. Colors represent the SNR value of each pixel as indicated by the scale bar below. (E) Normalized MIP showing the results of 2DTM using the template in (A) in the region of (C) indicated in red. (F) 3D slab indicating the locations and orientations of mature 60S-detected targets in the indicated region of (C). The red polypeptide indicates the location of the polypeptide exit tunnel on each 60S. (G) Bar chart indicating the number of mature 60S-detected targets identified in the indicated subcellular compartments in 28 images of the nuclear periphery. (H) Plot showing the density of mature 60S in the regions of the images corresponding to the nucleus (blue) or cytoplasm (red). Each dot represents a different image. The solid bar indicates the median. (I) 10 Å filtered 3D reconstruction calculated from 3991 60S subunits at the locations and orientations detected in 28 images, showing clear density for the 40S small subunit. The molecular model of the 60S used to generate the template in (A) is shown in yellow.


