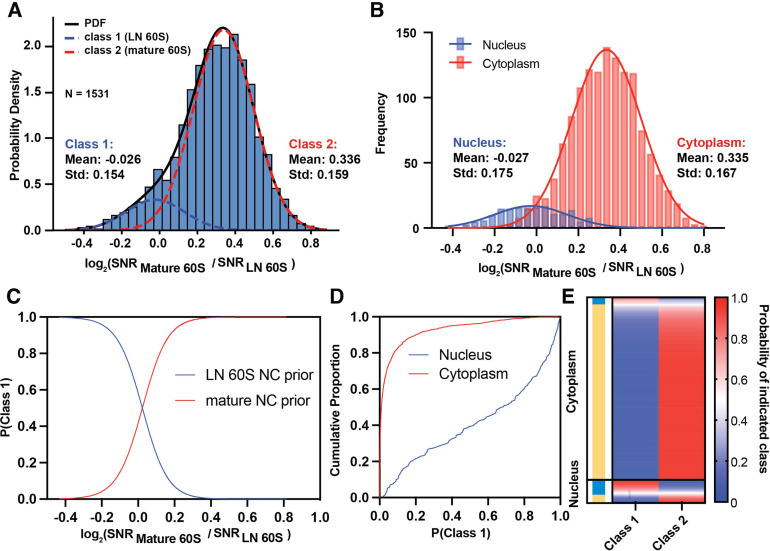
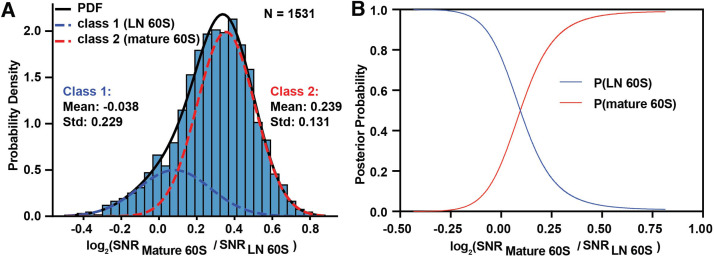
Figure 3. Relative probability of detecting mature or LN 60S.
(A) Histogram showing the distribution of the log2(mature 60S / LN 60S 2DTM SNR) values for each LN and mature 60S-detected target fit with two Gaussians indicating populations 1 (blue dashed line) and 2 (red dashed line). The black line indicates the sum of the two Gaussians, R2=0.993. (B) Histogram showing the log2(mature 60S / LN 60S 2DTM SNR) values for each nuclear (blue) or cytoplasmic (red) LN and mature 60S-detected target. The two subcellular populations are plotted independently. Solid lines indicate Gaussian fits. (C) Line graph showing the probability that a given target belongs to the LN 60S population (blue) line, or mature 60S population (red), as a function of log2 2DTM SNR ratio. (D) Line graph showing the fraction of nuclear (blue) and cytoplasmic (red) targets classified as LN 60S, at the indicated confidence intervals determined using Equation 6. (E) Heat map showing the probability of each LN and mature 60S-detected target belonging to either the LN or mature 60S populations. Each row indicates a detected target, and the rows are sorted by their subcellular distribution. The targets assigned to the mature 60S population are indicated in yellow and the targets assigned to the LN 60S population are indicated in blue.


