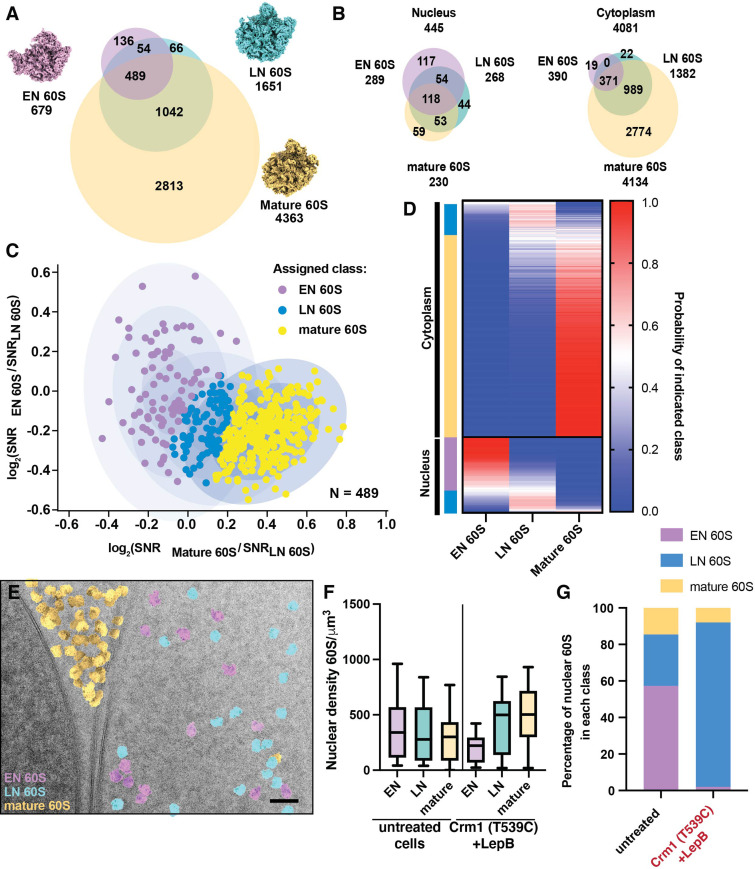
Figure 6. Classification of nuclear targets by relative similarity to early or late nuclear intermediates.
(A) Venn diagram showing the number of significant targets detected in 2DTM searches with the indicated templates. Overlap indicates targets identified in two or more searches. (B) Venn diagrams showing the number of significant targets detected in 2DTM searches with the indicated templates in the nucleus (left) and cytoplasm (right). (C) Scatterplot showing the log2(EN 60S / LN 60S 2DTM SNR) values relative to the log2(mature 60S / LN 60S 2DTM SNR) values for each EN, LN and mature 60S-detected target. Ellipses indicate the fits of three Gaussians and each concentric ellipse indicates one standard deviation from the mean. Each target is colored according to its most likely class membership. (D) Heat map showing the probability of each of the targets examined in (C) belonging to one of the populations, EN, LN or mature 60S. Targets are grouped by their subcellular localization, followed by their classification as EN 60S (purple), LN 60S (light blue), or mature 60S (yellow). (E) Cryo-EM micrograph of the yeast nuclear periphery from a FIB-milled lamella shown in in Figure 1, displaying the results of 2DTM searches, colored by their classification as mature 60S (yellow), LN 60S (blue) or EN 60S (purple) based on their relative 2DTM SNRs. (F) Boxplot showing the nuclear density of EN 60S (purple), LN 60S (light blue), and mature 60S (yellow) detected targets before classification in the indicated cells. (G) Bar chart showing the proportion of the LN 60S-detected targets in the indicated cells that are classified as LN 60S (blue), mature 60S (yellow), or EN 60S (purple).


