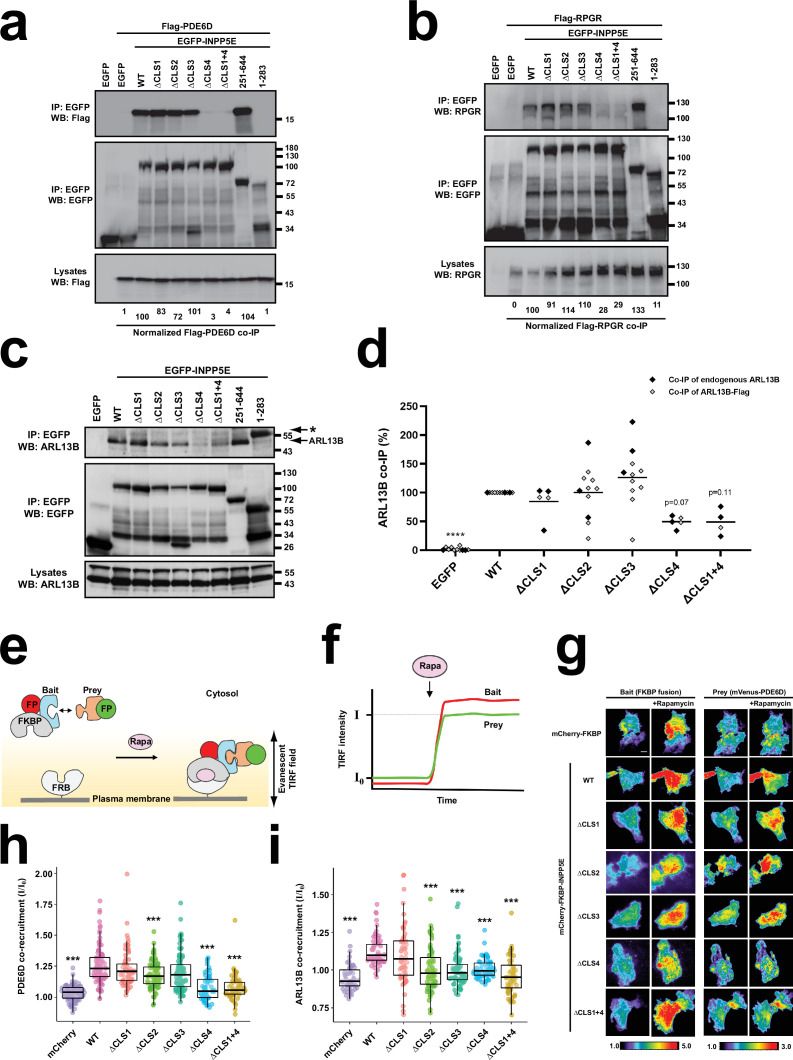
Figure 6. CLS4 promotes INPP5E binding to PDE6D, RPGR and ARL13B.
(a) The indicated EGFP-INPP5E variants were coexpressed in HEK293T cells with Flag-PDE6D, as indicated. Lysates were immunoprecipitated with GFP-Trap beads and analyzed by Western blot with the indicated antibodies. Molecular weight markers in kilodaltons are shown on the right. Quantitation of Flag-PDE6D co-immunoprecipitation (co-IP), as percentage relative to WT, is shown at the bottom. Quantitations are normalized relative to both immunoprecipitated EGFP constructs and lysate amounts of Flag-PDE6D. (b) Same experiment as in (a) but Flag-RPGR was used instead of Flag-PDE6D. Quantitations at the bottom are normalized relative to immunoprecipitated EGFP constructs. (c) Coimmunoprecipitation of endogenous ARL13B with the indicated EGFP-INPP5E constructs in HEK293T cells. Asterisk points to EGFP-INPP5E(1-283) band. (d) Quantitation of ARL13B co-IP with the indicated EGFP-INPP5E constructs from n=11 independent experiments in HEK293T cells. Black and grey dots correspond, respectively, to experiments where endogenous ARL13B or exogenous ARL13B-Flag co-IP was assessed. Not all samples were present in all experiments (but EGFP, WT, ΔCLS2 and ΔCLS3 were). Two-way ANOVA revealed significant differences between constructs (p<0.0001) but no significant differences between using endogenous or exogenous ARL13B. All data were then analyzed by one-way ANOVA followed by Tukey tests. Significance is shown relative to WT: p<0.0001 (****). (e) Schema of chemically-inducible co-recruitment assay. Rapamycin (Rapa)-induced interaction between FKBP and FRB is used to quantitate binding of prey candidates to a bait. FKBP is fused to the prey along with a fluorescent protein, while FRB is tethered to inner leaflet of plasma membrane. Upon rapamycin addition, FKBP binds to FRB, bringing bait (red FP) and associated prey (green FP) to the plasma membrane. (f) Recruitment of bait and prey to plasma membrane can be sensitively detected by TIRF microscopy as an increased fluorescence signal. The ratio of final to initial TIRF intensity upon rapamycin addition (I/I0) for the prey provides a quantitative measure of prey’s co-recruitment to plasma membrane by bait, and hence of the prey-bait interaction. (g) TIRF microscopy images showing rapamycin-induced plasma membrane recruitment of bait constructs (left) and the corresponding co-recruitment of prey (mVenus-PDE6D, right). Intensity scales are depicted at bottom. Scale bar, 10 µm. (h) Normalized rapamycin-induced co-recruitment of mVenus-PDE6D (prey) by mCherry-FKBP-INPP5E (WT or indicated mutants), or by mCherry-FKBP (mCherry) as negative control. Individual measurements of n>50 cells per condition are shown. Box and whisker plots represent median, first and third quartiles, and 95% confidence intervals. Statistical significance relative to WT is shown as *** p<0.001 (unpaired Student’s t-tests). (i) Normalized rapamycin-induced co-recruitment of ARL13B-EYFP (prey) by mCherry-FKBP-INPP5E (WT or indicated mutants), or by mCherry-FKBP (mCherry) as negative control. Data acquisition, analysis and representation as in (h).

