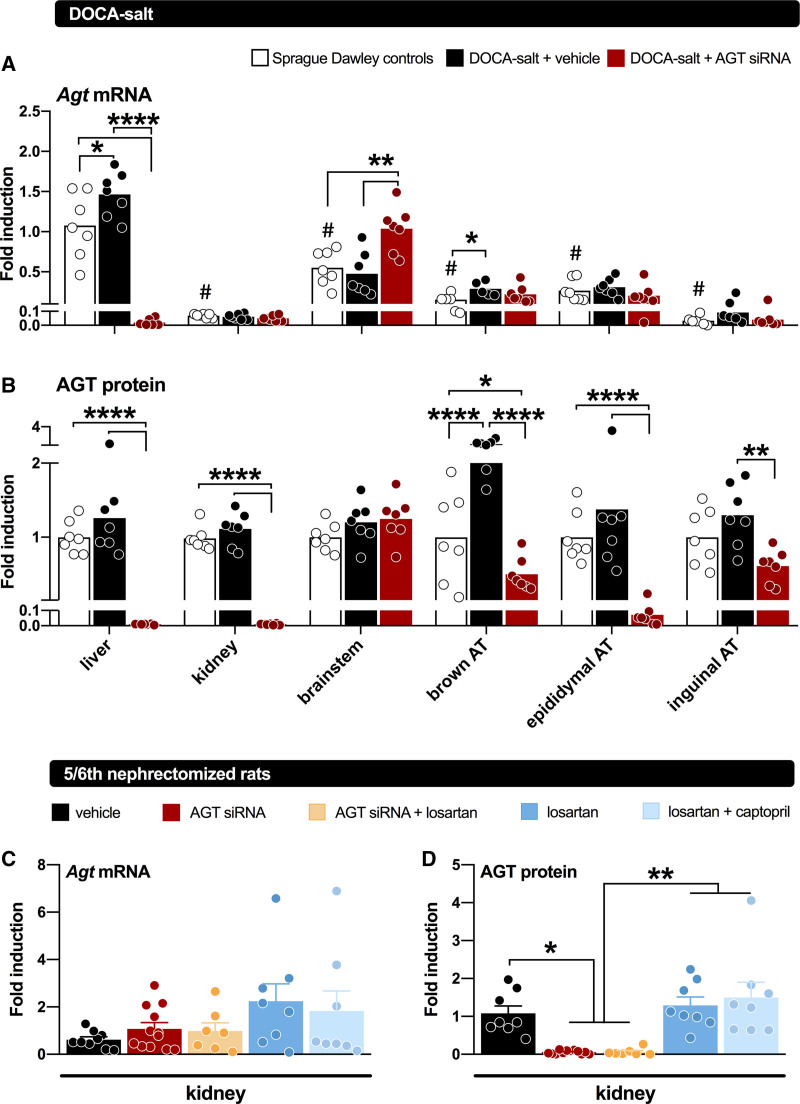
Figure 4.
Angiotensinogen (AGT) gene expression and protein abundance in tissues of rats. Top, tissue AGT gene expression (represented as mean fold induction relative to Agt expression in the livers of non–deoxycorticosterone acetate [DOCA] controls) in rats not given DOCA-salt (non-DOCA) or given DOCA-salt for 7 wk and treated with vehicle or AGT small interfering RNA (siRNA) during the final 3 wk (n=7 per group). Middle, AGT protein abundance of AGT in tissues of non-DOCA and DOCA-salt–treated rats given vehicle or siRNA, represented as mean fold induction relative to AGT abundance in the non-DOCA controls of each tissue. AGT mRNA (normalized vs β2-microglobulin) and protein (fold induction vs GAPDH) levels in kidneys of Sprague-Dawley rats subjected to 5/6th nephrectomy, and treated with either vehicle, AGT siRNA, AGT siRNA+losartan, losartan, or losartan+captopril for 28 days (n=7–12). Treatment was started after 5 wk of recovery. Data are mean±SEM. AT indicates adipose tissue. *P<0.05, **P<0.01, ***P<0.001, ****P<0.0001. Data have been modified from Uijl et al18 and Bovée et al.16

