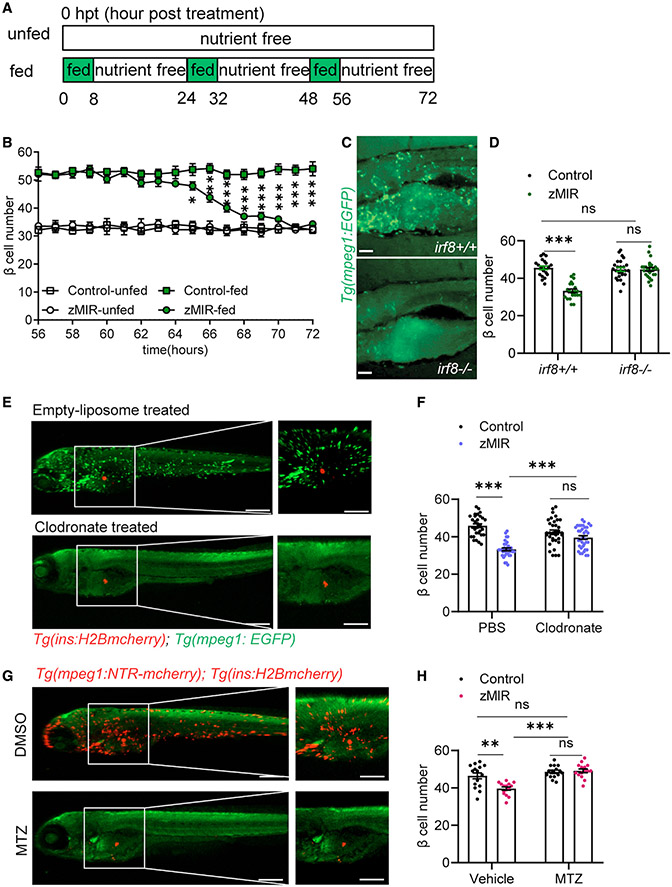
Figure 1. Macrophages are necessary for β cell loss in the setting of overnutrition.
(A) Schematic of the feeding regimen. Each day, fish were cultured for 8 h in nutrient-rich medium (5% chicken egg yolk) and for 16 h in nutrient-free medium, as indicated by the green and white rectangles, respectively. The 8-h culture in nutrient-rich medium is referred to as an overnutrition session. Time 0 starts at the onset of the first overnutrition 6 days post fertilization.
(B) Detailed β-cell number dynamics during the 16 h of nutrient-free medium culture from 56–72 h (n > 15/time point). Data are mean ± SEM. Multiple t tests were performed within the fed and unfed groups. *p < 0.05, **p < 0.01, ***p < 0.001.
(C) Macrophages in irf8−/− fish (bottom) and control (top). Scale bars, 200 μm.
(D) Effect of genetic deficiency of macrophages (irf8−/−) on β cell number. Data are mean ± SEM. n > 15/group, two-way ANOVA followed by Tukey’s multiple comparisons test; ns, not significant; ***p < 0.001.
(E) Effect of clodronate liposomes (bottom) and empty liposomes (top) on macrophages. A green signal from Tg(mpeg1:EGFP) marks macrophages. A red signal from Tg(ins:H2B-mcherry) labels β cells. Liposomes were injected at 32 hpt, and fish were imaged at 64 hpt. Scale bars, 300 μm; scale bars within panels, 50 μm. See also Figure S1D.
(F) Effect of clodronate liposomes on β cell loss in zMIR fish. Data are mean ± SEM. n > 20/group, two-way ANOVA followed by Tukey’s multiple comparisons test; ***p < 0.001.
(G) Effect of metronidazole (MTZ) and DMSO on macrophages in zMIR fish with Tg(mpeg1:NTR-mcherry). Scale bars, 300 μm; scale bars within panels, 50 μm. See also Figure S1F.
(H) Effect of macrophage ablation by MTZ on β cell loss. Data are mean ± SEM. n > 15/group, two-way ANOVA followed by Tukey’s multiple comparisons test; **p < 0.01, ***p < 0.001.

