
Figure 1.
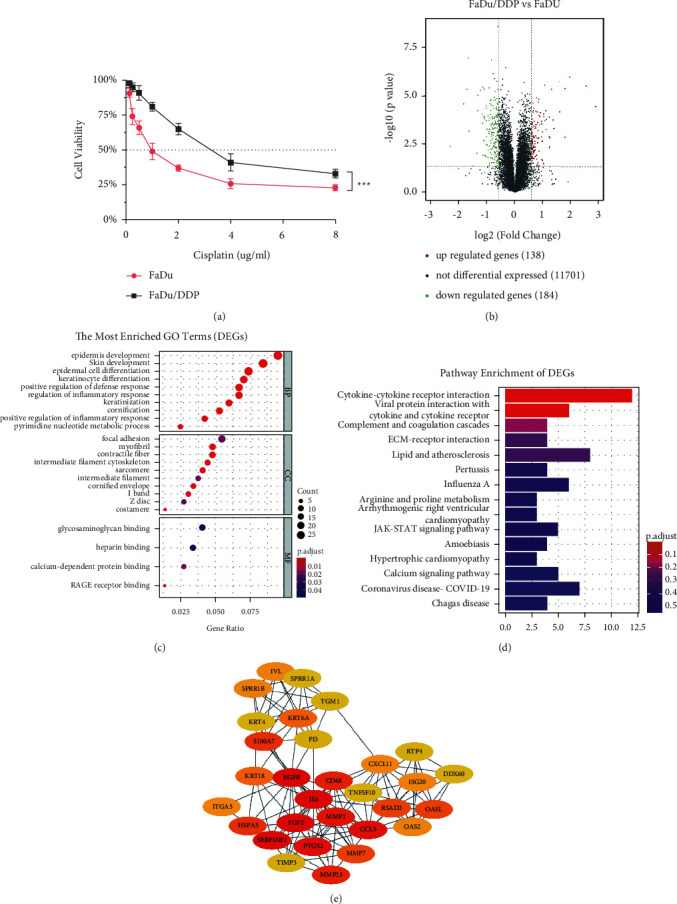
Analysis of differential expression genes in FaDu and FaDu/DDP. (a) Cisplatin-sensitivity of FaDu and FaDu/DDP cell lines. (b) DEGs volcano gram of the RNA seq. (c) GO analysis of DEGs. Top 10 enriched terms in BP, CC, and MF with a p value less than 0.05. (d) KEGG pathway analysis of DEGs enriched the top 15 pathways with a p value less than 0.05. (e) The PPI network among 30 differentially expressed cisplatin-resistance related genes.