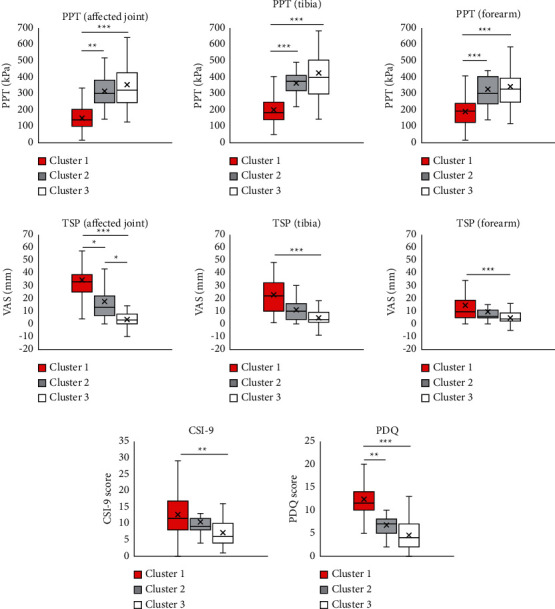
Figure 3.

Pressure pain threshold, temporal summation of pain, Central Sensitization Inventory-9, and painDETECT Questionnaire of each cluster. Data are presented as mean ± SD (n = 101). The symbols ∗, ∗∗, and ∗∗∗indicate significant difference between clusters (P < 0.05, 0.01, 0.001, respectively). PPT, pressure pain threshold; TSP, temporal summation of pain; CSI-9, Central Sensitization Inventory-9; PDQ, painDETECT Questionnaire; VAS, visual analog scale.
