
Figure 1: Example of a Directed Acyclic Graph (DAG) of an opioid taper protocol and dependency.
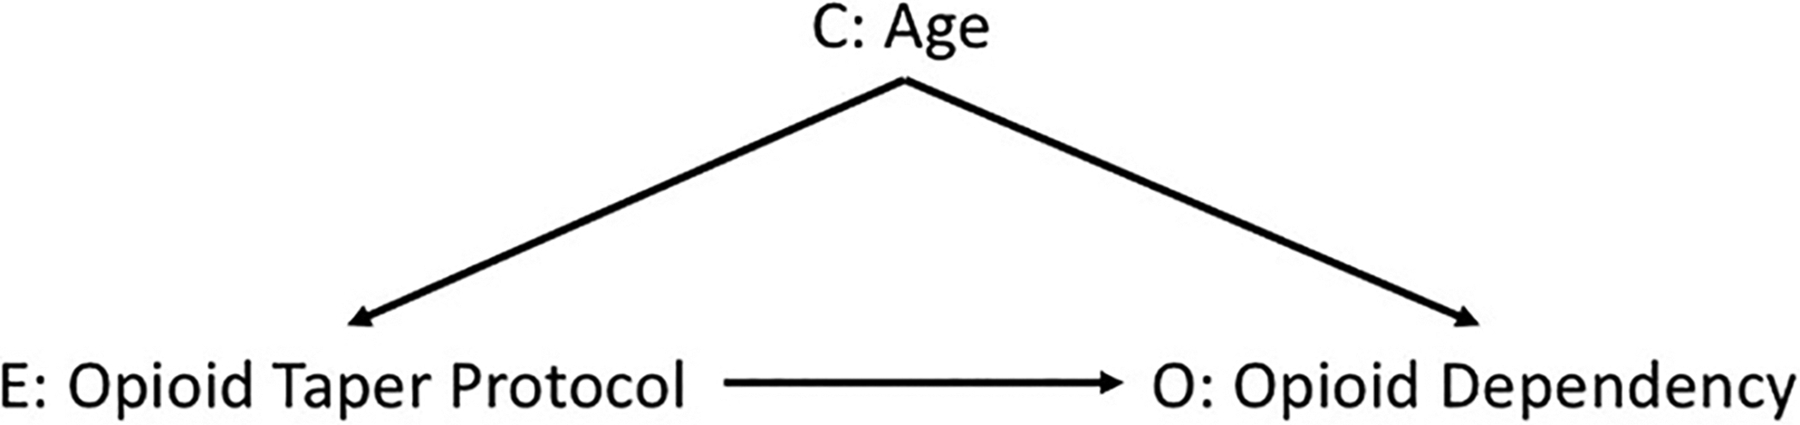
E indicates the exposure variable, O indicates the outcome of interest, and C indicates a confounding variable.
Official websites use .gov
A
.gov website belongs to an official
government organization in the United States.
Secure .gov websites use HTTPS
A lock (
) or https:// means you've safely
connected to the .gov website. Share sensitive
information only on official, secure websites.
E indicates the exposure variable, O indicates the outcome of interest, and C indicates a confounding variable.