FIGURE 2.

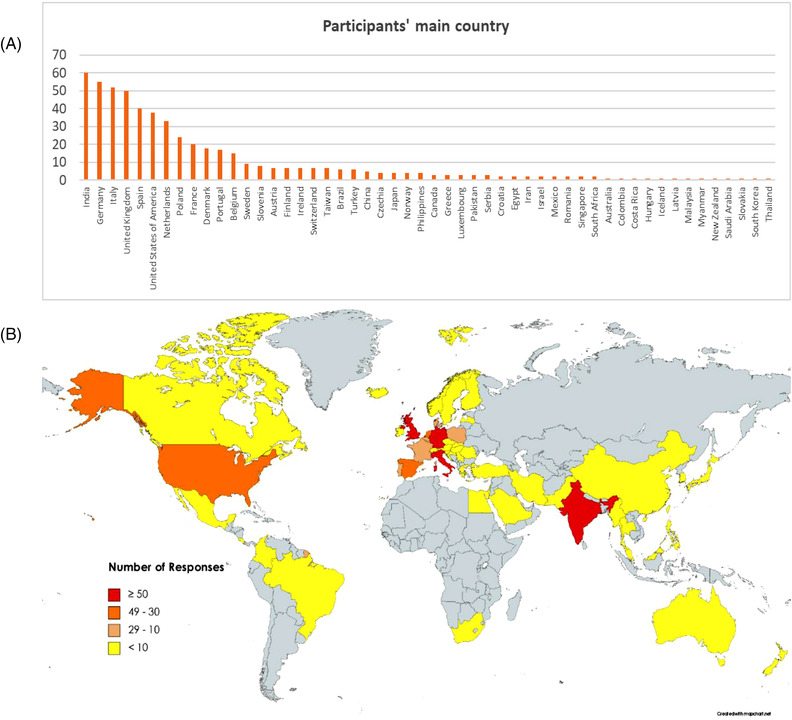
Main country of origin of survey respondents (A and B). Graph in a shows absolute number of replies. https://mapchart.net/terms.html

Main country of origin of survey respondents (A and B). Graph in a shows absolute number of replies. https://mapchart.net/terms.html