FIGURE 4.

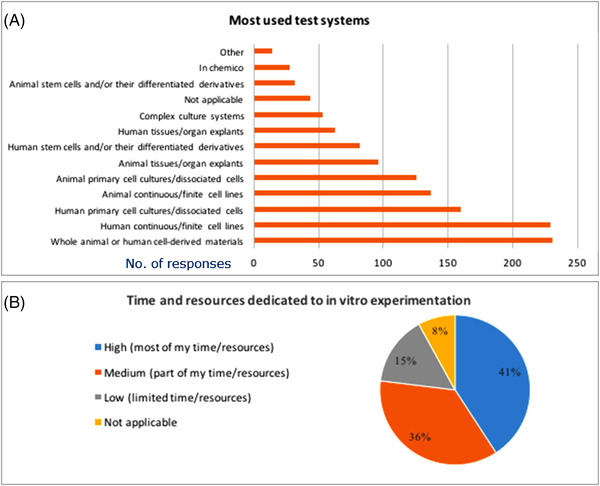
Most used test systems (A) and time and resources dedicated to in vitro experimentation (B). In A) respondents could select more than one option, and graph shows absolute number of replies. B) shows percentages of replies

Most used test systems (A) and time and resources dedicated to in vitro experimentation (B). In A) respondents could select more than one option, and graph shows absolute number of replies. B) shows percentages of replies