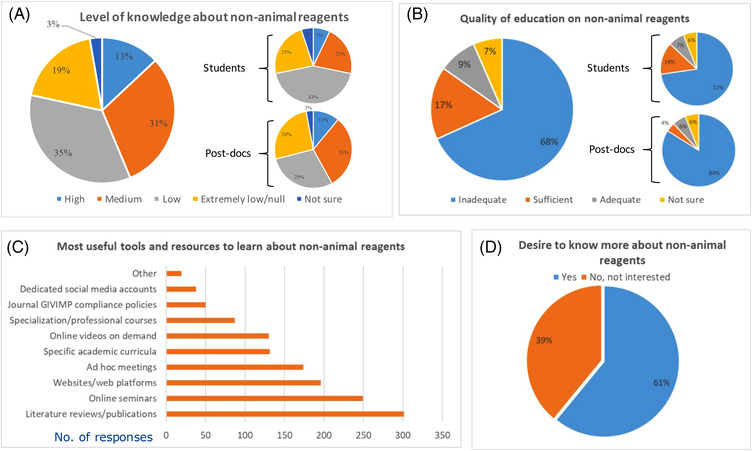
FIGURE 8.

Level of knowledge (A), quality of education (B), tools for knowledge sharing (C) and interest to know more about non‐animal alternatives (D). In A and B, disaggregated data are also shown for the groups of students and post‐docs. In C) respondents could select more than one option and graph shows absolute number of replies. In A), B), and D) percentages of replies are shown
