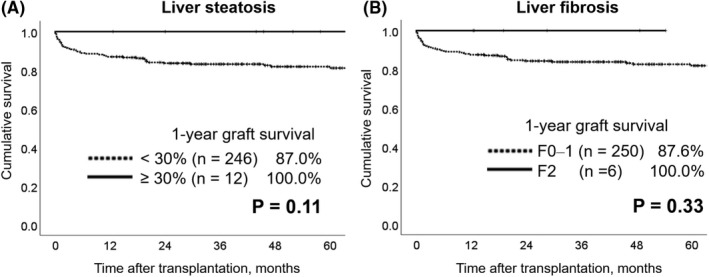
FIGURE 4.

Graft survival with and without liver steatosis or fibrosis. Kaplan‐Meier curves of graft survival with (≥30%) and without (<30%) liver steatosis are shown in (A), and those with (F2) and without (F0‒1) liver fibrosis are shown in (B). There was no graft loss for livers with steatosis and those with fibrosis
