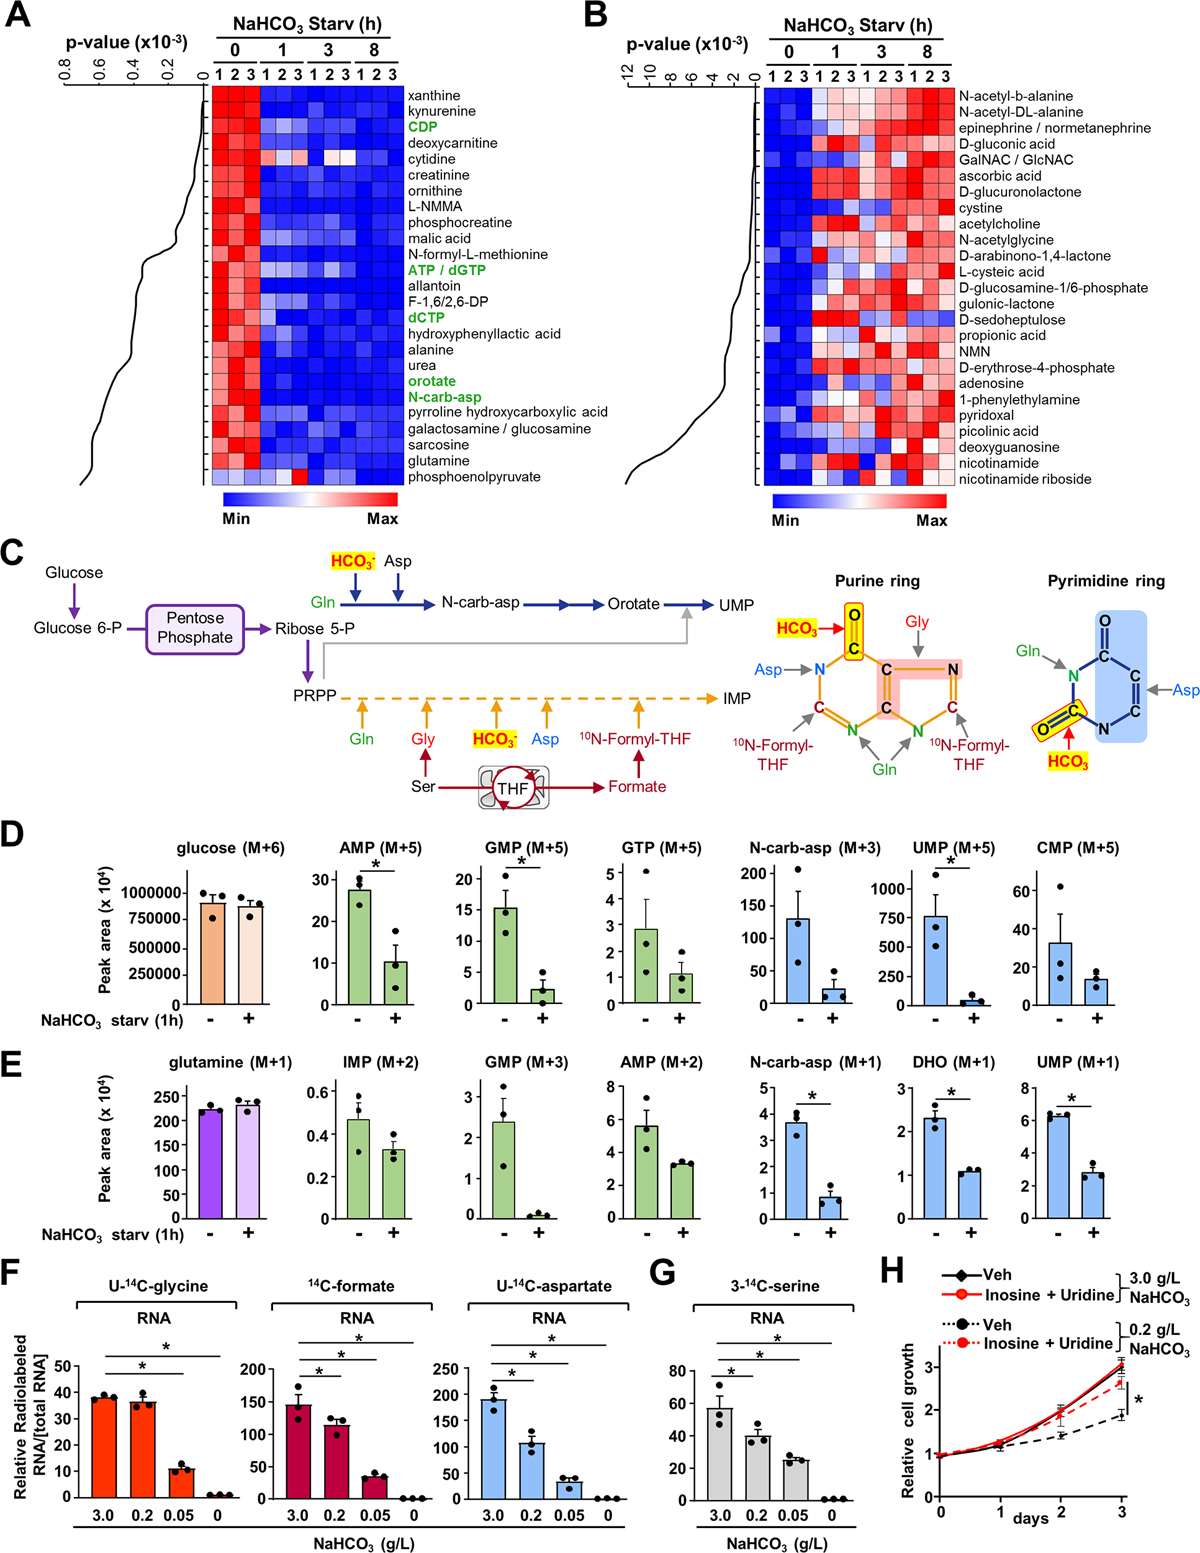
Figure 1. Influence of sodium bicarbonate levels on nucleotide synthesis activity.

(A, B) Steady-state metabolite profiles from HeLa cells cultured in buffered DMEM medium (20 mM HEPES) in the presence or absence of sodium bicarbonate (NaHCO3) over the indicated times. Intracellular metabolites from three independent samples per condition were profiled by means of liquid chromatography‒mass spectrometry LC-MS/MS and ranked by those significantly decreased upon NaHCO3 depletion (8 h) relative to non-depleted condition (A) or increased upon NaHCO3 depletion (8 h) (B). The top 25 most significant metabolites are shown as row-normalized heat maps (A, B) ranked according to p-value. The complete metabolite profiles from these samples are provided in Table S1.
(C) Schematic illustrating the fate of the carbon and oxygen from bicarbonate and other metabolites into the pyrimidine and the purine rings.
(D) Normalized peak areas of 13C-labeled purine and pyrimidine intermediates, as measured by targeted LC-MS/MS, in HeLa cells grown in dialyzed serum and depleted of NaHCO3 for 1 h and labeled with 13C6-glucose for 1 h.
(E) Normalized peak areas of 15N-labeled purine intermediates from HeLa cells treated as in (D) and labeled with 15N-(amide)-glutamine for 1 h.
(F, G) Radiolabeling was performed for 3 h in the presence of the indicated concentrations of NaHCO3 (g/L) reflecting de novo purine synthesis (U-14C-glycine, 14C-formate), pyrimidine synthesis (U-14C-aspartate), or one-carbon metabolism (3-14C-serine).
(H) Proliferation of HeLa cells grown in dialyzed serum with indicated NaHCO3 concentrations in buffered medium supplemented or not with purine nucleoside (inosine 60 μM) and pyrimidine nucleoside (uridine 100 μM).
(D)-(H) The data are graphed as the means ± SDs of biological triplicates and are representative of at least two independent experiments. *p < 0.05, by two-tailed Student’s t-test for pairwise comparisons in (D, E) or one-way ANOVA with Tukey’s post hoc test for multiple pairwise comparisons (F, G, H).
