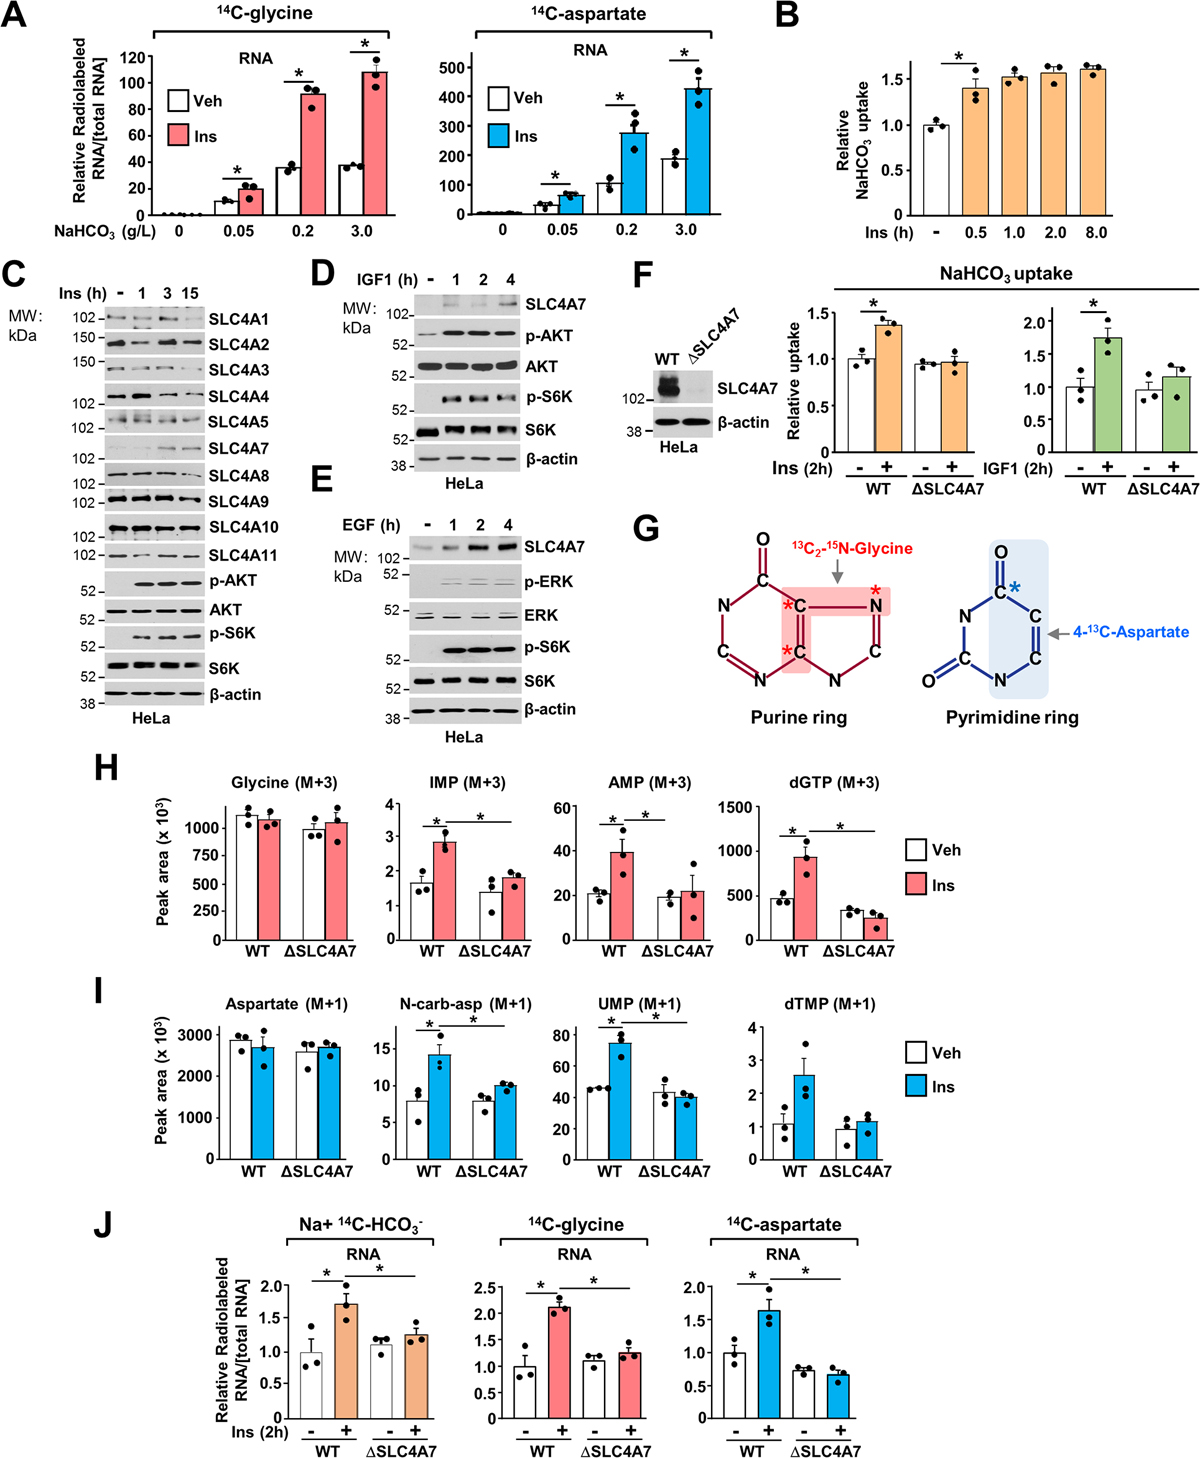
Figure 3. Growth factor signaling stimulates SLC4A7 expression and promotes bicarbonate uptake to promote nucleotide synthesis.

(A) Relative incorporation of radiolabels from 14C-glycine or 14C-aspartate (3 h labeling) into RNA from HeLa cells serum starved for 15 h and stimulated or not with insulin (100 nM) for 3 h in the presence of the indicated concentration of NaHCO3 (g/L).
(B) NaHCO3 uptake in HeLa cells serum starved for 15 h and stimulated or not with insulin (100 nM) over a time course.
(C) Immunoblots of HeLa cells serum starved for 15 h and stimulated or not with Insulin (100 nM) over a time-course.
(D, E) Immunoblots of HeLa cells serum starved for 15 h and stimulated or not with IGF1 (50 nM) (D) or EGF (50 ng/mL) (E) over a time-course
(F) Immunoblots of HeLa cells validating SLC4A7 loss (ΔSLC4A7) after gene editing through CRISPR-Cas9. NaHCO3 uptake in wild-type or ΔSLC4A7 HeLa cells serum starved for 15 h and stimulated or not with Insulin (100 nM) or IGF1 (50 nM) for 2 h and labeled for 5 min with Na+, 14C-HCO3− to measure. Uptake measurements are shown as relative to the vehicle-treated wildtype cell line.
(G) Illustration of the carbon and nitrogen from glycine and aspartate incorporated into the purine and pyrimidine ring, respectively.
(H) Normalized peak areas of 13C, 15N-labeled purine intermediates measured via LC-MS/MS in wild-type and ΔSLC4A7 HeLa cells, serum starved for 15 h and stimulated with insulin for 6 h and labeled with 13C2-15N-glycine (M+3) for the last hour.
(I) Normalized peak areas of 13C-labeled pyrimidine intermediates measured and treated as in (H) but stimulated with insulin for 2 h and labeled with 4-13C-aspartate (M+1) for the last hour.
(J) Wild-type and ΔSLC4A7 HeLa cells were serum starved for 15 h and stimulated or not with insulin (100 nM) for 2 h in the presence of the indicated radiotracers.
(A), (B), (F), (H)-(J) The data are plotted as the means ± SDs of biological triplicates and are representative of at least two independent experiments. *p < 0.05, by one-way ANOVA with Tukey’s post hoc test for multiple pairwise comparisons.
