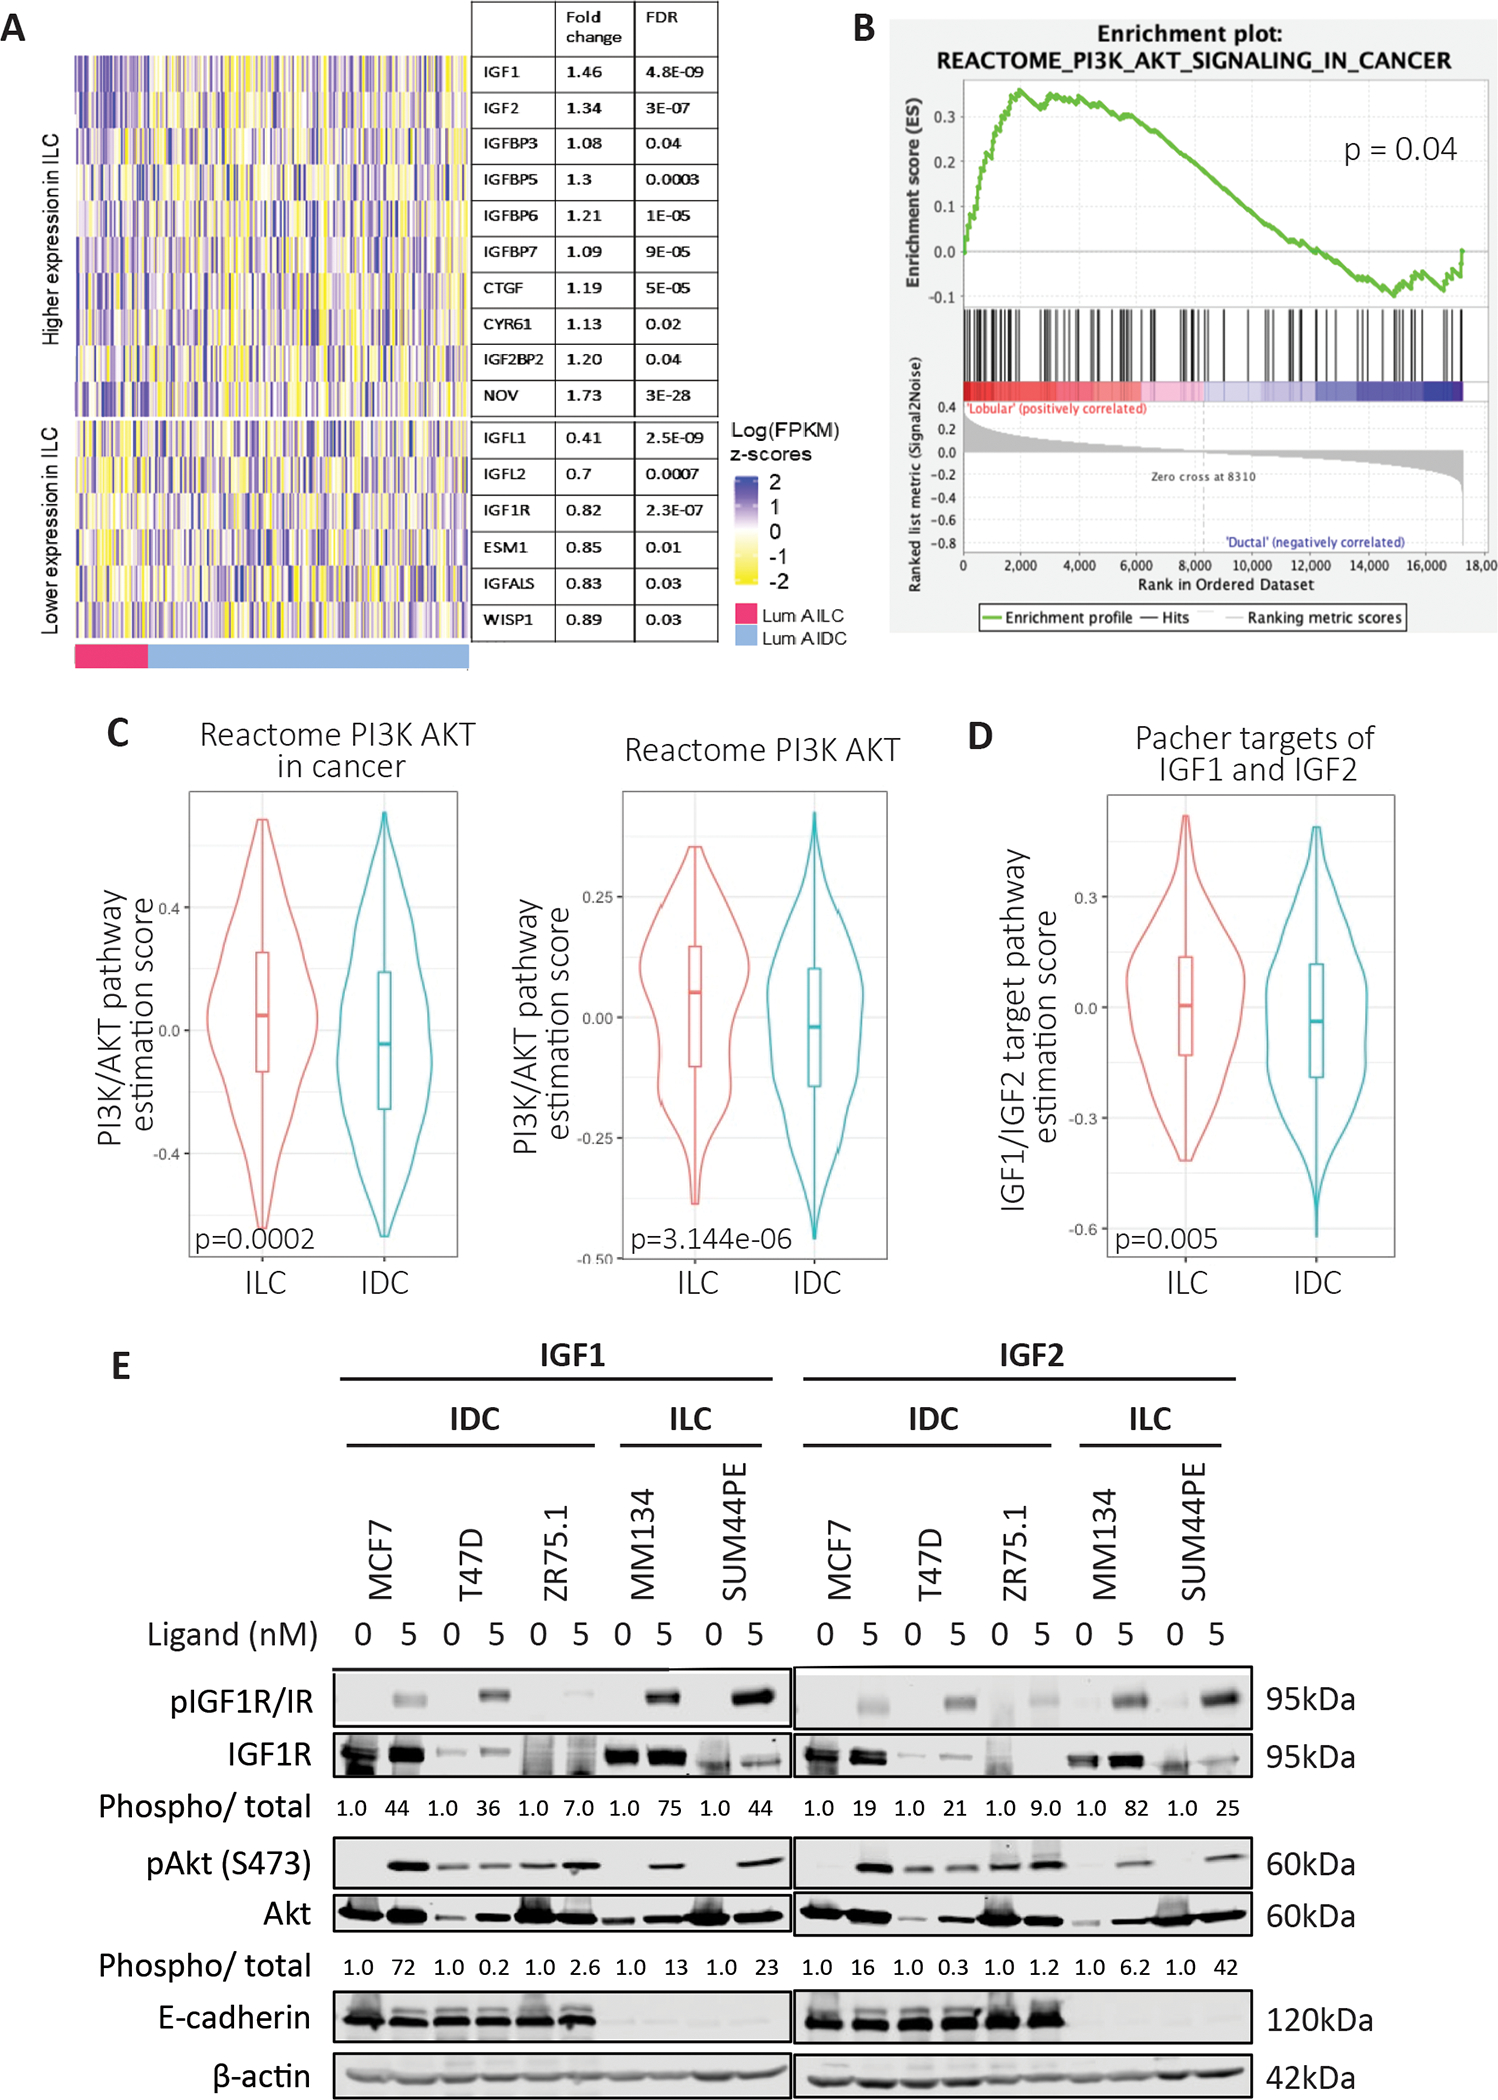
Figure 1: IGF pathway activity is enhanced in ILC patient samples and cell lines in vitro.

(A) Gene expression analysis of growth factor signaling related genes comparing Luminal A IDC and ILC with significantly different fold change and FDR values displayed. (B) GSEA analysis for PI3K/Akt showing significantly higher pathway activation in ILC samples obtained from the SCANB dataset. (C, D) GSVA analysis of Luminal A IDC and ILC samples using respective signature sets from MSigDB with significantly higher pathway activation in ILC. (E) IDC cells (MCF7, T47D, ZR75.1) and ILC cells (MDA-MB-134-VI, SUM44PE) were stimulated with doses of IGF1 or IGF2 (0–5nM) for 15 minutes following an overnight serum starvation. IGF1R/IR and Akt signaling was assessed by Western blotting. Phosphorylation levels of IGF1R (phospho-IGF-I Receptor β (Tyr1135/1136)/Insulin Receptor β (Tyr1150/1151)) and Akt (S473) were quantified on the LiCOr Odyssey CLx Imaging system and normalized to corresponding total protein levels and loading controls. Quantified values are indicated below the Western bands. Ligand treated sample values were further normalized to respective cell line vehicle treated samples. Representative experiment shown for all, N=2–3 for each experiment.
