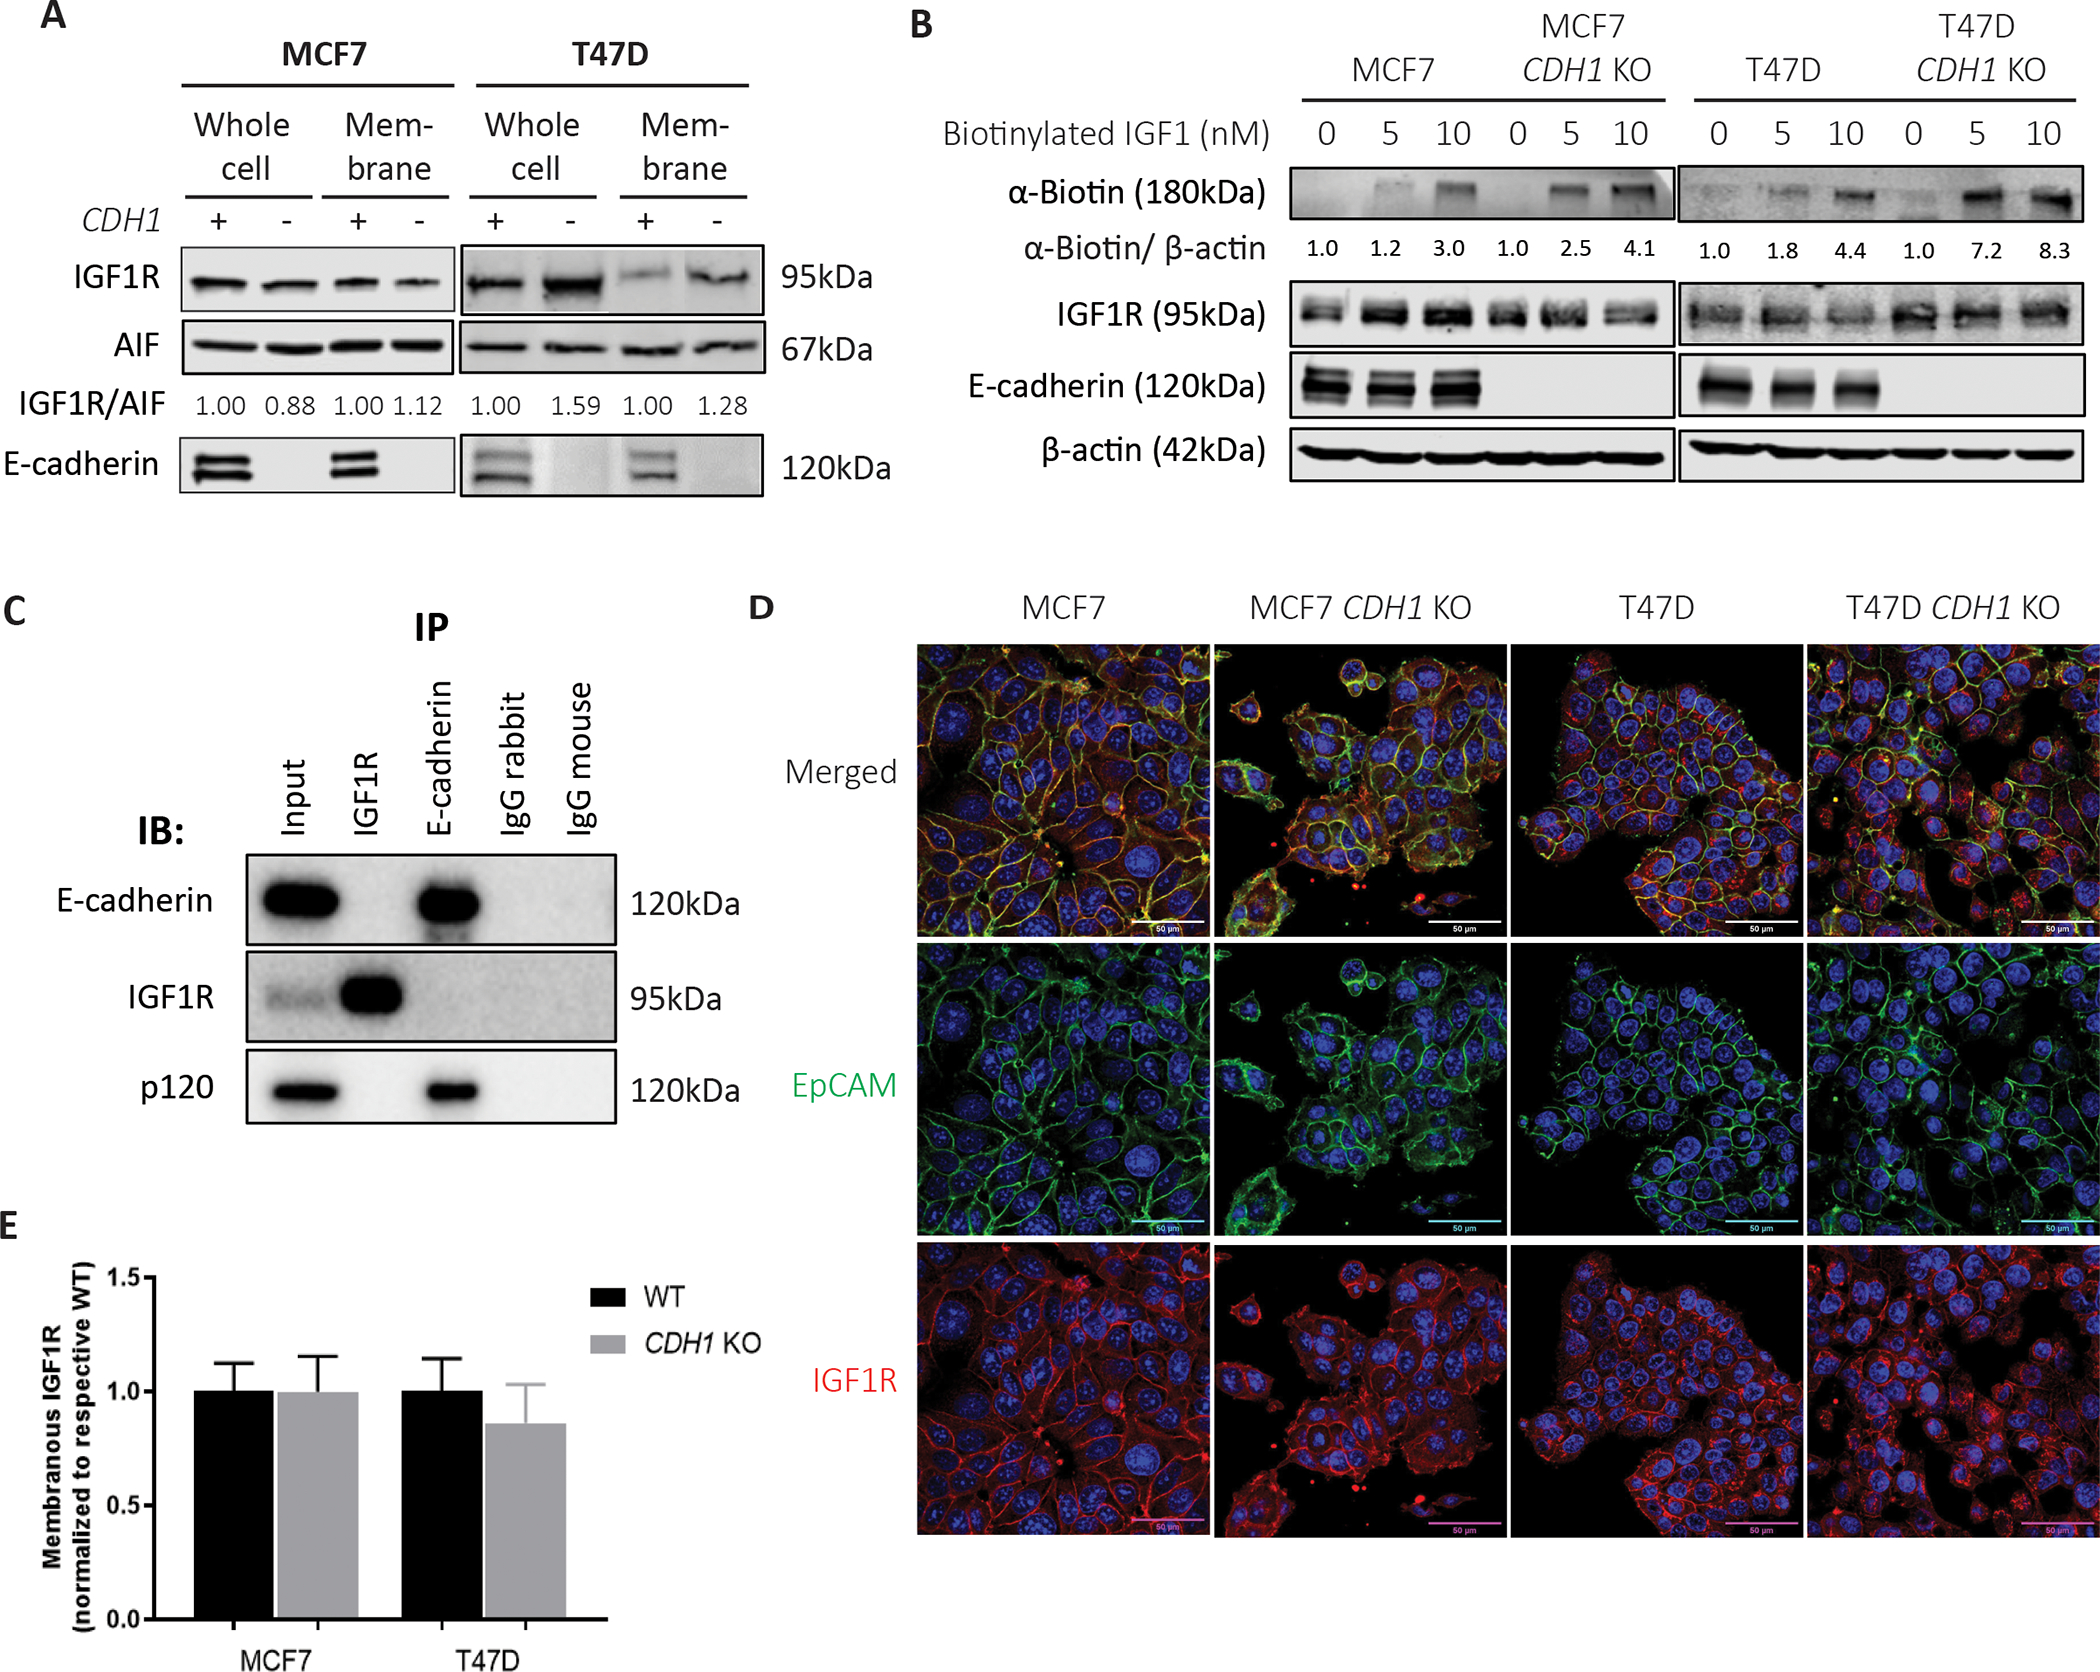
Figure 4: Loss of E-cadherin increases IGF1R availability on the membrane to allow ligand binding.

(A) Cell fractionation assay performed on MCF7 and T47D WT and CDH1 KO cells to assess whole cell and membrane IGF1R expression levels. IGF1R bands were quantified and normalized to membrane control, AIF1. Quantified values are indicated below the Western bands. (B) Cells were stimulated with biotinylated IGF1 (0–10nM) for 10 minutes and crosslinked to assess ligand-receptor complex levels between WT and CDH1 KO cells. (C) Immunoprecipitation of IGF1R and E-cadherin in T47D cells was assessed for a co-IP of other proteins, with p-120 catenin assessed as a known interactor of E-cadherin. (D, E) Cell lines were dual stained for EpCAM (green) and IGF1R (red) and imaged by confocal microscopy at a 60X objective. Scale bar: 50μm. 12 images for each cell line were quantified and graphed (E). Representative experiment shown for all, N=2–3 for each experiment.
