
Figure 5: Loss of E-cadherin enhances anoikis resistance and increases cell survival.
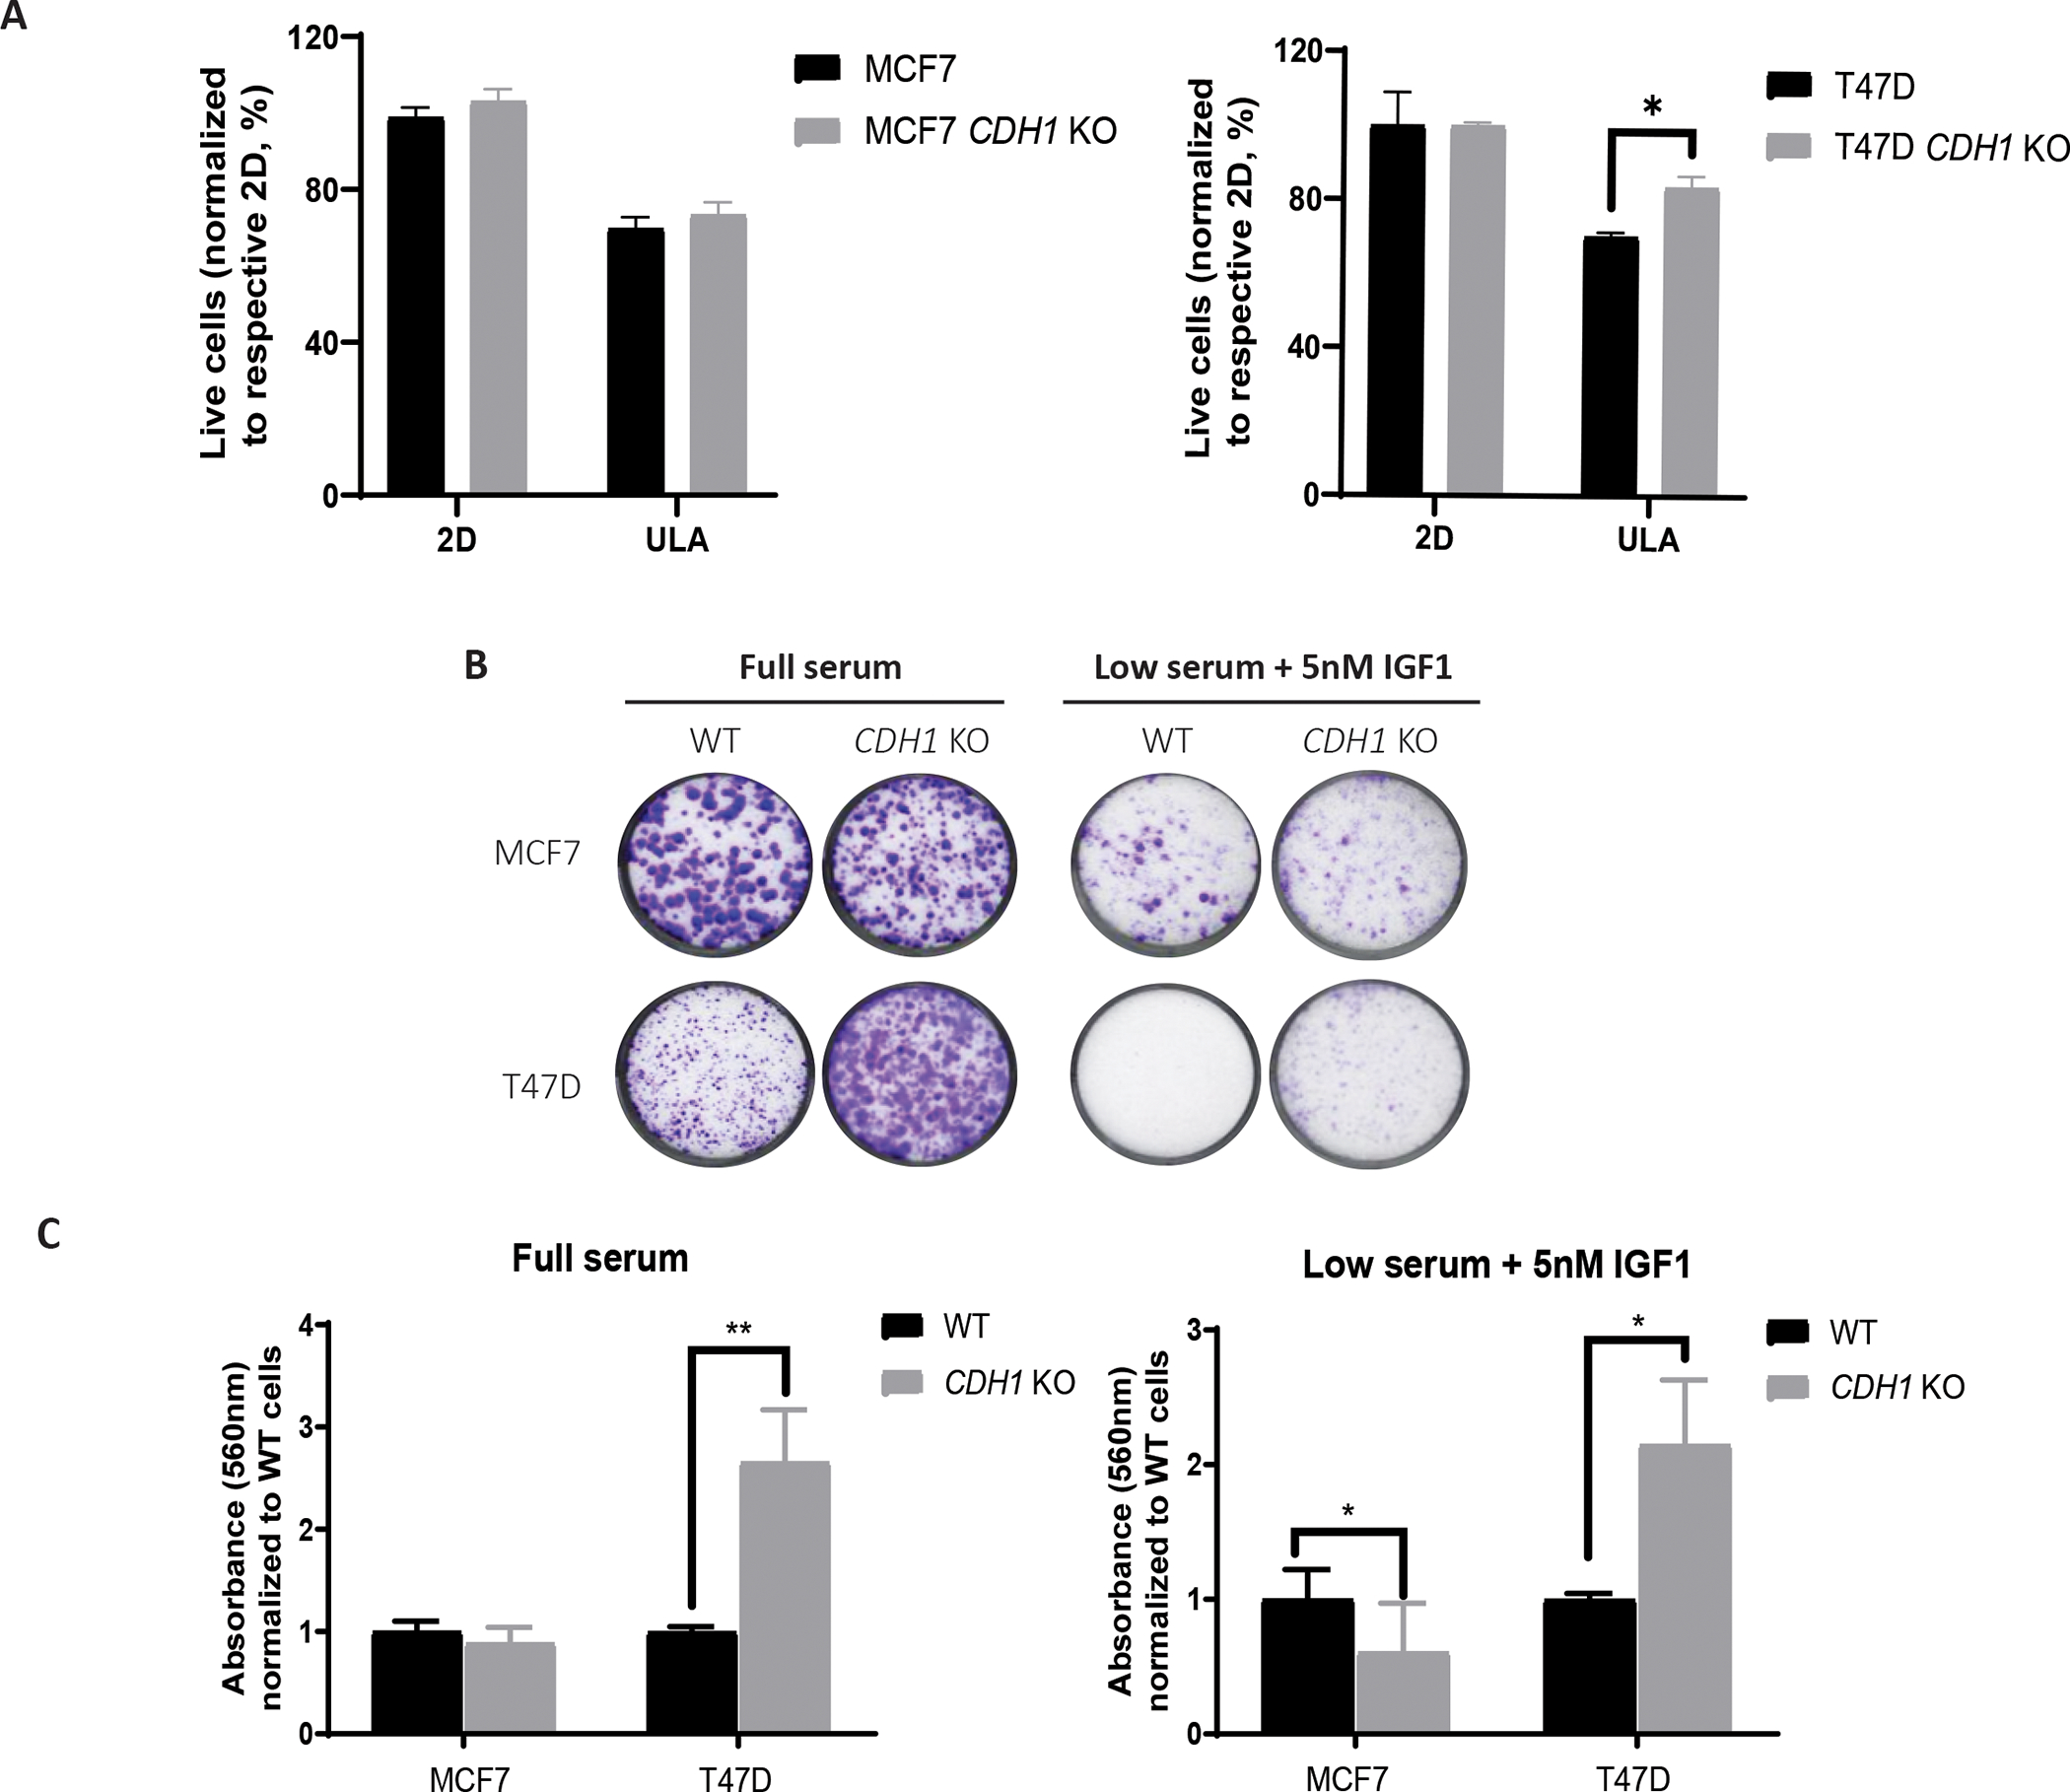
(A) MCF7 and T47D cells were grown in 2D and ULA plates for 3–4 days and stained with Annexin V and propidium iodide to measure live and apoptotic cells, respectively. Live cell percentage in 2D for each cell line was used to normalize the live cell percentages in ULA plates. Representative experiment shown; N=3 (each with three biological replicates). (B, C) Cells were plated at 2,000 cells/well in full serum and low serum supplemented with 5nM IGF1 media and stained with 0.5% Crystal Violet after two to three weeks. Representative images are shown. Plates were de-stained with 10% acetic acid, absorbance quantified and graphed after normalization to WT cells of corresponding conditions. Statistical differences were evaluated using two-way ANOVA (*p < 0.05, **p<0.01, ***p<0.001, representative experiment shown, N=3 (each with three biological replicates)).