
Figure 7: Loss of E-cadherin sensitizes cells to Fulvestrant and IGF1R/PI3K/Akt/MEK inhibitors in a context dependent manner.
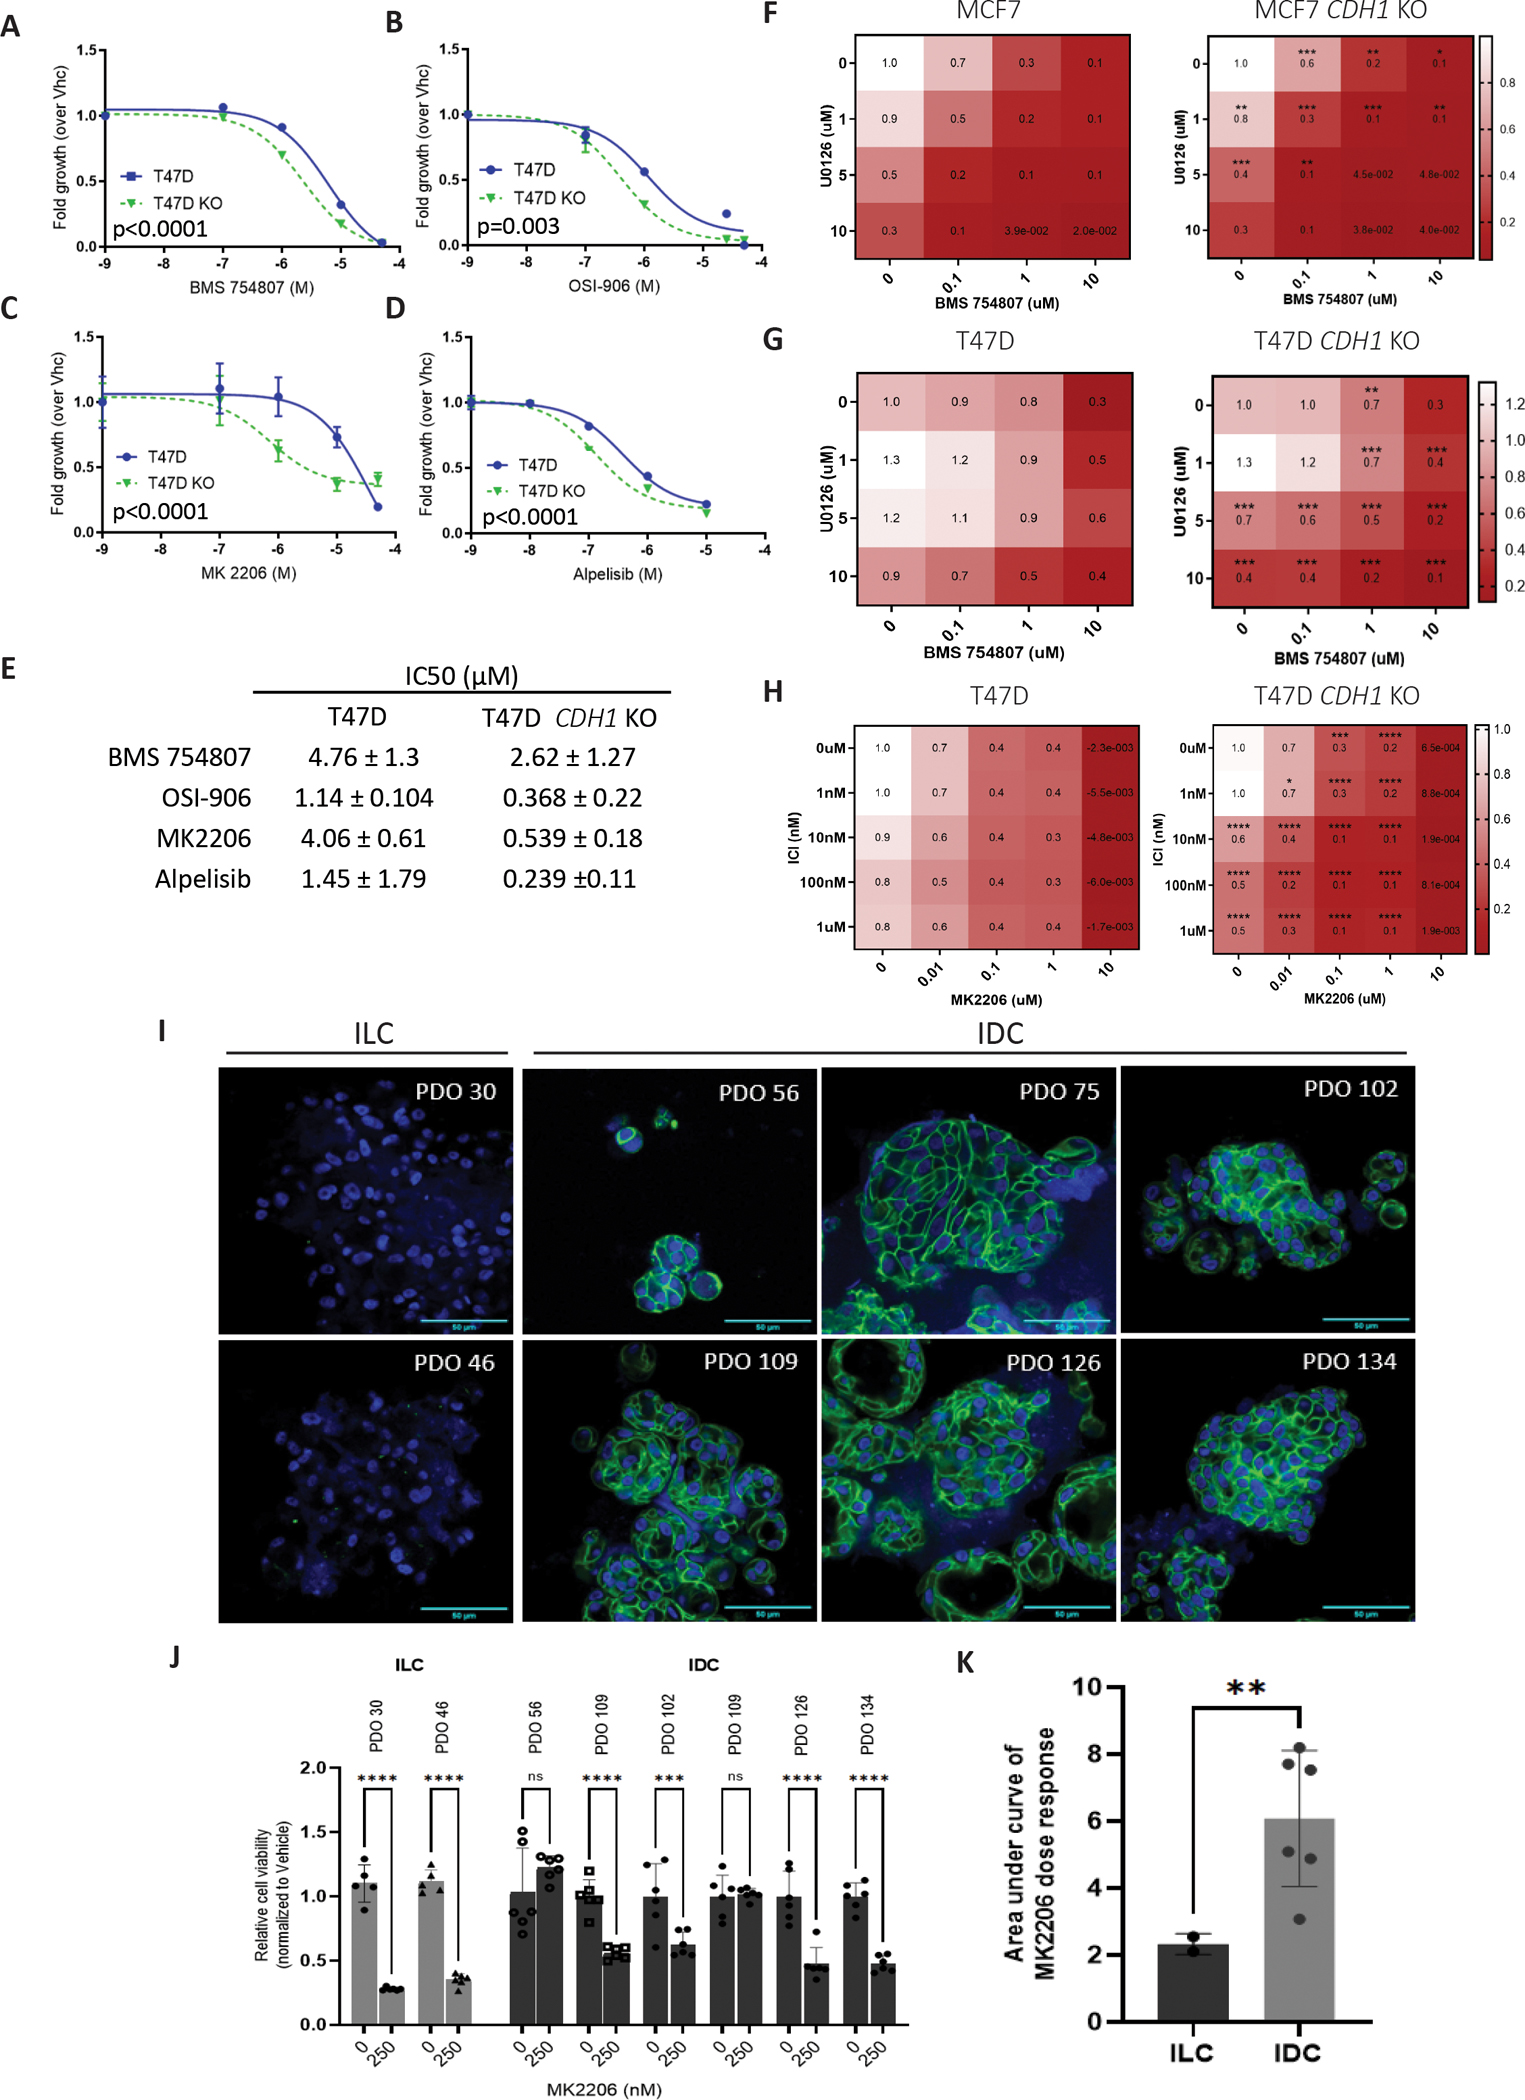
T47D parental and CDH1 KO cells were seeded in 96-well 2D plates and treated with IGF1R inhibitors (OSI-906 or BMS-754807), PI3K inhibitor (Alpelisib) or Akt inhibitor (MK2206) for 6 days. Conditions in the panels as follows: (A) BMS-754807; (B) OSI-906; (C) MK2206, (D) Alpelisib and (E) shows a summary of IC50 values. CellTiter Glo assay was used to assess cell viability (relative luminescence) and data was normalized to vehicle treated control. (F, G) Cells were treated a combination of MEK inhibitor (U0126) and BMS-754807 for 6 days and viability assessed as above. (H) Cells were treated a combination of Akt inhibitor (MK2206) and Fulvestrant for 6 days and viability assessed as above. IC50 values for viability were calculated by nonlinear regression and statistical differences evaluated using sum-of-squares Global f-test (p < 0.05; representative experiment shown; N=3 (each with six biological replicates)). (I) E-cadherin immunofluorescence was performed on patient derived IDC and ILC organoids. Green: E-cadherin and blue: Hoechst. Scale bar: 50um. (J) ILC and IDC organoids were treated with Akt inhibitor (MK2206) for 12 days and viability assessed with CellTiter Glo 3D (relative luminescence), and data was normalized to vehicle treated cells. Statistical differences were evaluated using 2way-ANOVA (**p<0.005, ***p<, 0.0005***p<0.0001; representative experiment shown; n=1 (each with six biological replicates)). (K) Area under curve of IDC and ILC organoids dose response with MK2206 was calculated from (J), with statistical differences evaluated using unpaired t-tests (p=0.0056).