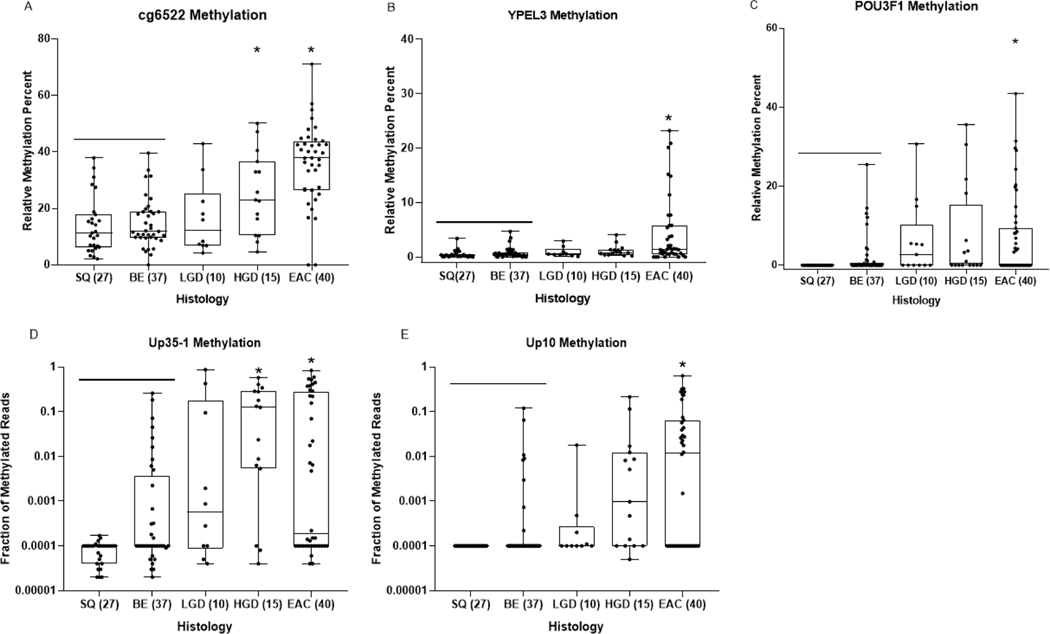
Figure 3:
Dot-plot graphs of individual markers Cg6522, YPEL3, POU3F1, Up35–1 and Up10 (A, B, C, D, E, respectively) in DNA extracted from esophageal cytology brushing sample set 2 (validation brushing sample set). Each sample was defined by histologic diagnosis, shown on x-axis, as determined by pathologist D.R. The y-axis shows the relative methylation percent when compared to the reference gene C-LESS for total DNA, as measured by MS-ddPCR assays for each marker in panels A,B,C. The fraction of methylated reads is plotted on the Y axis in panels D and E. One way ANOVA was used to determine statistical significance between histologic groups based on relative methylation percent. P-values < 0.01 when compared to SQ/BE tissue are considered significant (*).

