FIGURE 3.

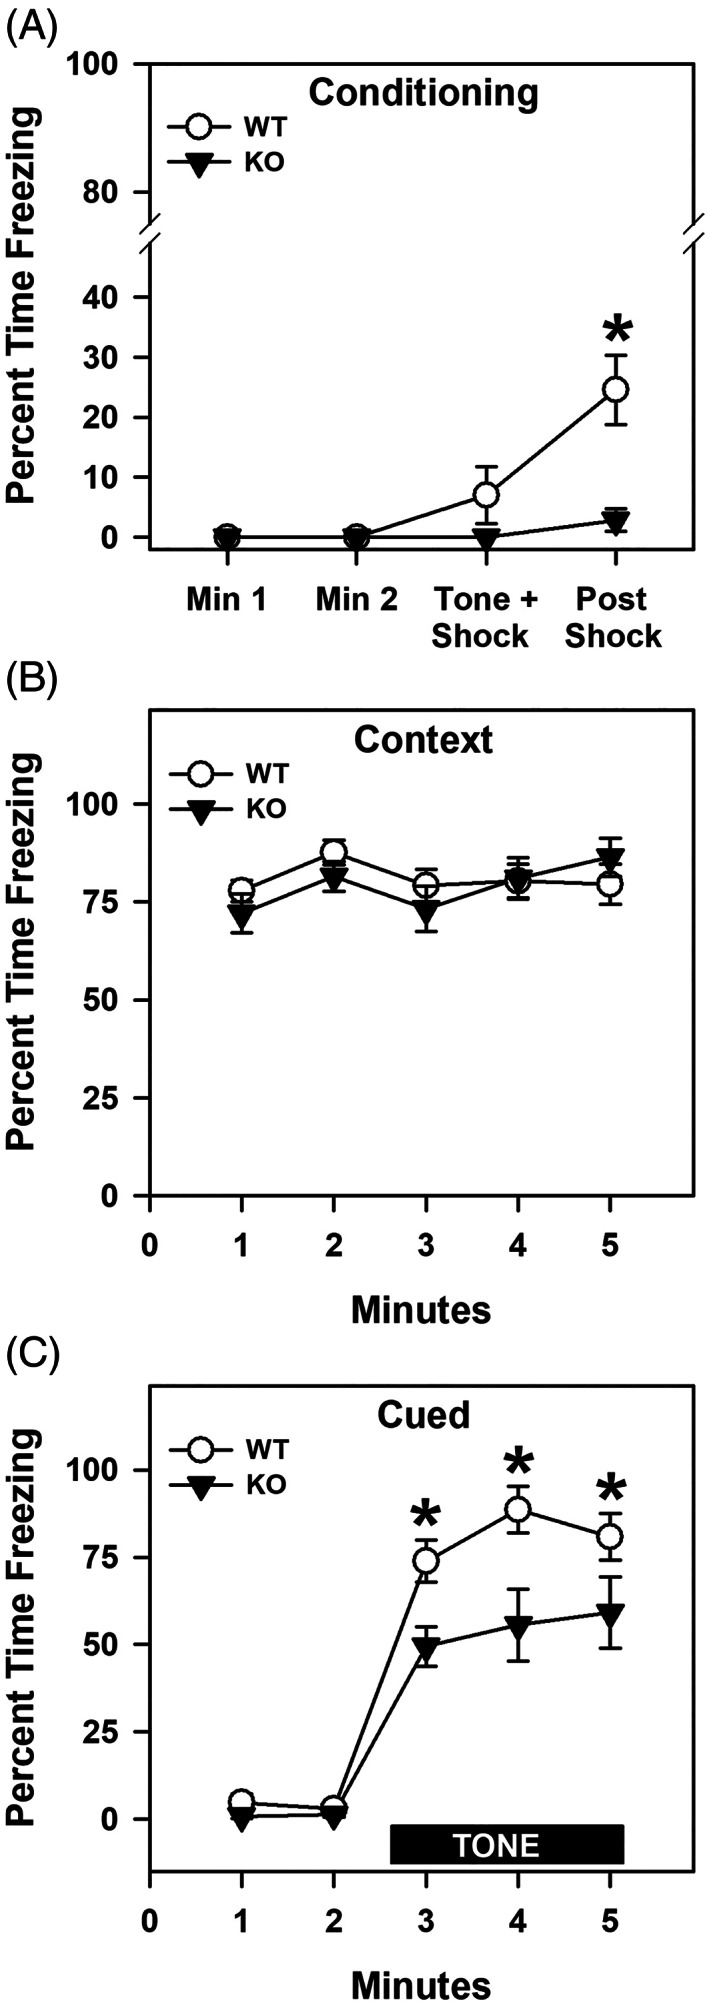
Freezing responses of WT and proSAAS KO mice in fear conditioning. (A) Percent freezing in the 2 min prior to CS presentation, during the CS interval, and following the CS‐UCS pairing. A RAMONA found a significant main effect of time [F (3,51) = 10.132, p < 0.001] and genotype [F (1,17) = 12.611, p = 0.002], as well as a significant time by genotype interaction [F (3,51) = 6.132, p = 0.001]. (B) Percent freezing during context testing shown in 1 min blocks across the 5 min test. An ANOVA failed to detect any significant effects. (C) Percent time spent freezing during cued testing depicted in 1 min blocks across the 5 min test. During the first 2 min no CS or UCS were presented, while in the final 3 min the CS alone was present. A RAMONA noted a significant effect of time [F (4,68) = 85.041, p < 0.001] and genotype [F (1,17) = 29.666, p < 0.001]; the time by genotype interaction was also significant [F (4,68) = 3.048, p = 0.023]. N = 9–10 mice/genotype; *p < 0.05, KO versus WT controls
