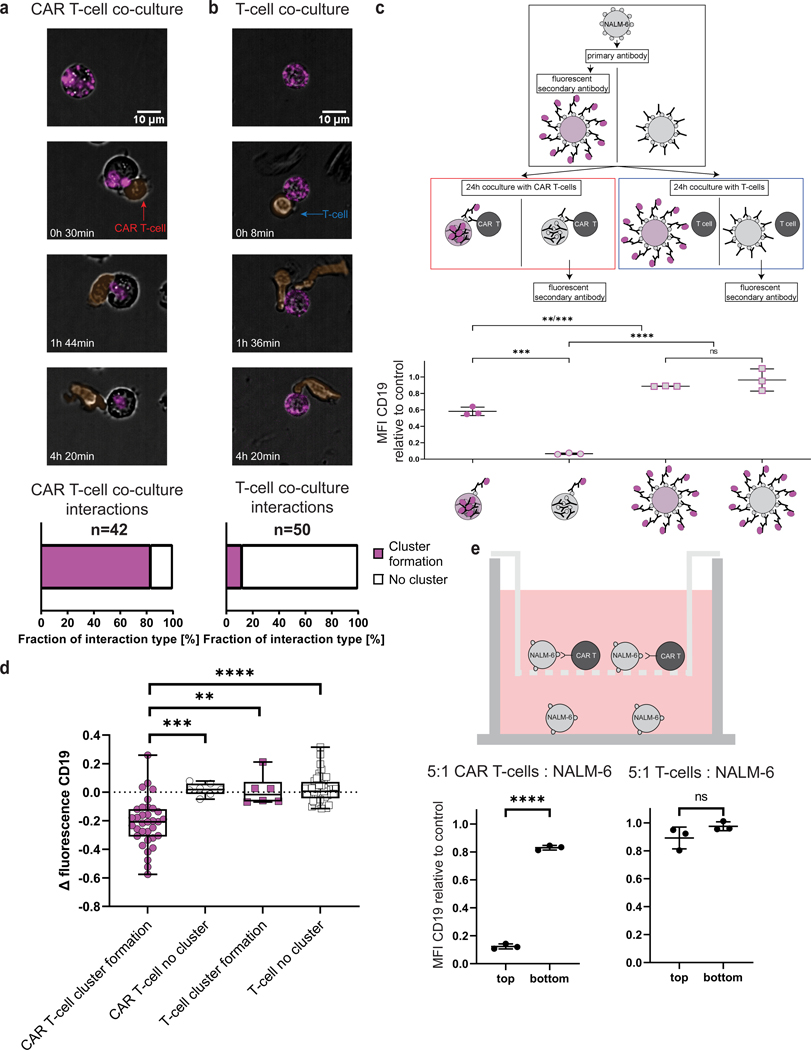
Figure 2. CD19 CAR T cells promote target receptor clustering and internalization in B-ALL cells.
a-b, Time lapse of CD19 distribution in NALM-6 B-ALL cells interacting with CAR T cells (a) or uninfected control T cells (b). Effector and target cells were co-cultured at a 1:1 ratio for 6h (end point), at 20x magnification. Scale bar length 10μm. Effector cells pseudo-colored in orange, CD19 labeled with an AF647-conjugated anti-CD19. a, Representative interaction of a CAR T cell and a NALM-6 B-ALL cell with CD19 clustering and internalization characterized as “cluster formation” (Supplementary Movie S4) with quantification below (83.33% of CAR T – NALM-6 interactions showed CD19 cluster formations during interactions). b, Representative interaction of a control uninfected T cell and a NALM-6 B-ALL cell with no change in CD19 distribution characterized as “no cluster” (Supplementary Movie S5) with quantification below (88% of T-cell – NALM-6 interactions do not show a change of CD19 distribution). c, Experimental work-flow to quantify CD19 internalization. Target cells stained with primary unconjugated anti-CD19 and secondary PE-conjugated antibody either before or after 24h of co-culture. PE-conjugated antibody staining after 24h of co-culture only stains CD19 molecules on the cell surface that were not internalized (data normalized to triple-stained (CD19 PE, CFSE, 7-AAD) control cells that have not been co-cultured with effector cells, representative of two independent experiments, n=3. P values determined by Tukey’s multiple comparisons test). d, Fluorescence intensity decreases in CAR T–cell exposed NALM-6 cells with CD19 “clustering” over 6h compared to uninfected control T cell–exposed NALM-6 cells. Boxplots show minimum, 25th percentile, median, 75th percentile and maximum values. P values determined by two-tailed Mann Whitney test. e, Top, schematic of transwell assay to determine influence of soluble mediators for CD19 internalization. Bottom, mean fluorescence intensity of CD19 expression by live target cells in bottom well after 24h of co-culture (data normalized to triple-stained (CD19 PE, CFSE, 7-AAD) control cells that have not been co-cultured with target cells). P values determined by unpaired t-test, n=3. **=p<0.01, ***=p<0.001, ****=p<0.0001, ns=not significant. Data are mean ± s.d).

